A clear disadvantage of working with cordova using the CLI (and not Android Studio directly) is that you can't debug properly or get a detailed information about a native error (unless during the runtime of the app on a device), for example analyze the following class of a cordova plugin:
package com.ourcodeworld.plugins;

import org.apache.cordova.*;
import org.json.JSONArray;
import org.json.JSONException;
import android.content.Intent;
import android.content.Context;
import android.widget.Toast;

public class randomClass extends CordovaPlugin {

    @Override
    public boolean execute(String action, JSONArray data, CallbackContext callbackContext) throws JSONException {
        if (action.equals("executeAwesomeFunction")) {
            /**
             * !!!!!!!!!!!!!!!!!!!!!!!!!!!!!!!!!!!!!!!!!
             * The following code will throw an exception and will make your app crash !
             **/
            Intent intent = new Intent("com.nononsenseapps.filepicker.FilePickerActivity");
            intent.putExtra("some_data", "data");
            cordova.startActivityForResult((CordovaPlugin) this, intent, 0);
            return true;
        } else {
            return false;
        }
    }

    @Override
    public void onActivityResult(final int requestCode, final int resultCode, final Intent data) {
        showToast("Enviar aquí resultado cordova");
        if(resultCode == cordova.getActivity().RESULT_OK){
            // Some Code to Handle response
            return;
        }else if(resultCode == cordova.getActivity().RESULT_CANCELED){
            // Some Code to Handle response
            return;
        }

        super.onActivityResult(requestCode, resultCode, data);
    }

    /**
     * Show a toast with some message
     */
    public void showToast(String toLog){
        Context context = cordova.getActivity();
        int duration = Toast.LENGTH_SHORT;

        Toast toast = Toast.makeText(context, toLog, duration);
        toast.show();
    }
}
Theoretically, the previous code will compile and won't show any error while you build or run the app using cordova run android in the console (however, the error is in the execute function and we'll clear you why later). Now, the previous class will be exposed and triggered in Javascript using myApp.executeAwesomeFunction() so if you compile the app, and you trigger the function, boom:

Your app will simply stop working without any useful or visible information about what happened. So basically, if you're working in your plugin and you don't have any idea of what is failing, you probably want to kill yourself right now. However, not everything is lost, unless not yet. If you have an android device, an USB cable you can learn how to check for errors.
Debugging
In order to debug from your device, we need to rely on adb logcat. Logcat is a command-line tool that dumps a log of system messages, including stack traces when the device throws an error and messages that you have written from your app with the Log class (check more about the class in the official documentation).
This tool (executable in Windows) is available in the Android SDK, so if you can compile your app, you have already installed Android Studio. Now, to debug your application on the device, follow these steps:
1. Connect your device
As first step, is recommended to connect as first your device to give time, so the computer recognize it.
2. Execute adb
As a good practice (practice that make the debug process easy), we are going to redirect all the output of the command-line tool into a log file (log.txt located somewhere in your system).
Open the command prompt (cmd.exe) and execute the following command and let it running in the background while you debug (stop it when you're not debugging to prevent useless output):
adb logcat > C:\Users\sdkca\Desktop\log.txtThe command should create a log.txt file in the desktop and it will be constantly update with the output from ADB while you use your app. Generally, in Windows adb is not available as an environment variable (learn to create environment variables in this article) so if you want to do it quick, you can provide the absolute path of the executable in the console.
In this case, adb.exe is located in the following folder in our Windows:
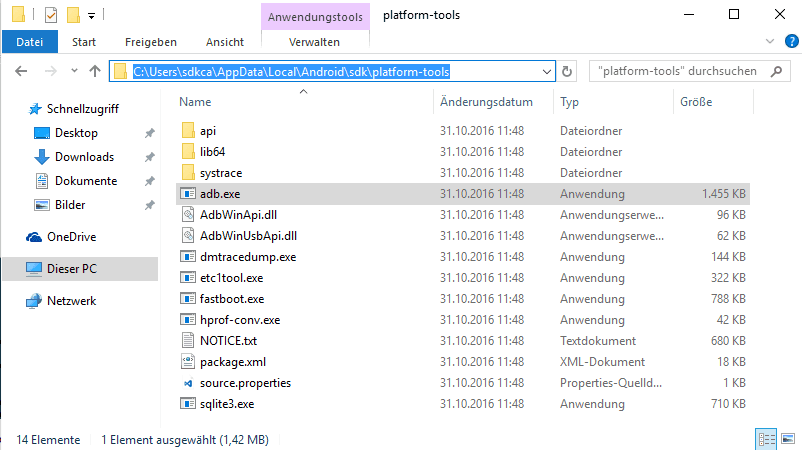
So, we would use the following command instead:
C:\Users\sdkca\AppData\Local\Android\sdk\platform-tools\adb.exe logcat > C:\Users\sdkca\Desktop\log.txtNow ADB should be running in your command prompt and won't stop unless you do.
3. Build and install your app on the device
Compile with the cordova CLI your application using wheter cordova run android --device or whatever you use. Note that since the moment when the app is installed and execute in your app, logcat will start generating and saving output in the log.txt file. The order that we provide in this tutorial (connect device, start logcat and then install your app) is useful because for some developers, the app crashes at the beginning (so logcat will catch the error and will save the content in the log file).
4. Test and check what is failing
Assuming that your app works fine, but when you execute some Javascript it crashes, its the time to check for errors! In our example, the app crashes when we execute the myApp.executeAwesomeFunction() in Javascript. That should stop the application in Android, now we need to check what did logcat retrieve in the output.
If your app already crashed, stop ADB in your command using CTRL+BREAK or just closing the command prompt window (this to prevent the generation of more text in the log or to allow to open the file because sometimes, as adb writes on it, it won't open till ADB is closed) and open your log.txt file.
Finally comes the maybe uncomfortable moment, you need to check the log file (focus on the time in which you tested your app and you'll find the error quickly):
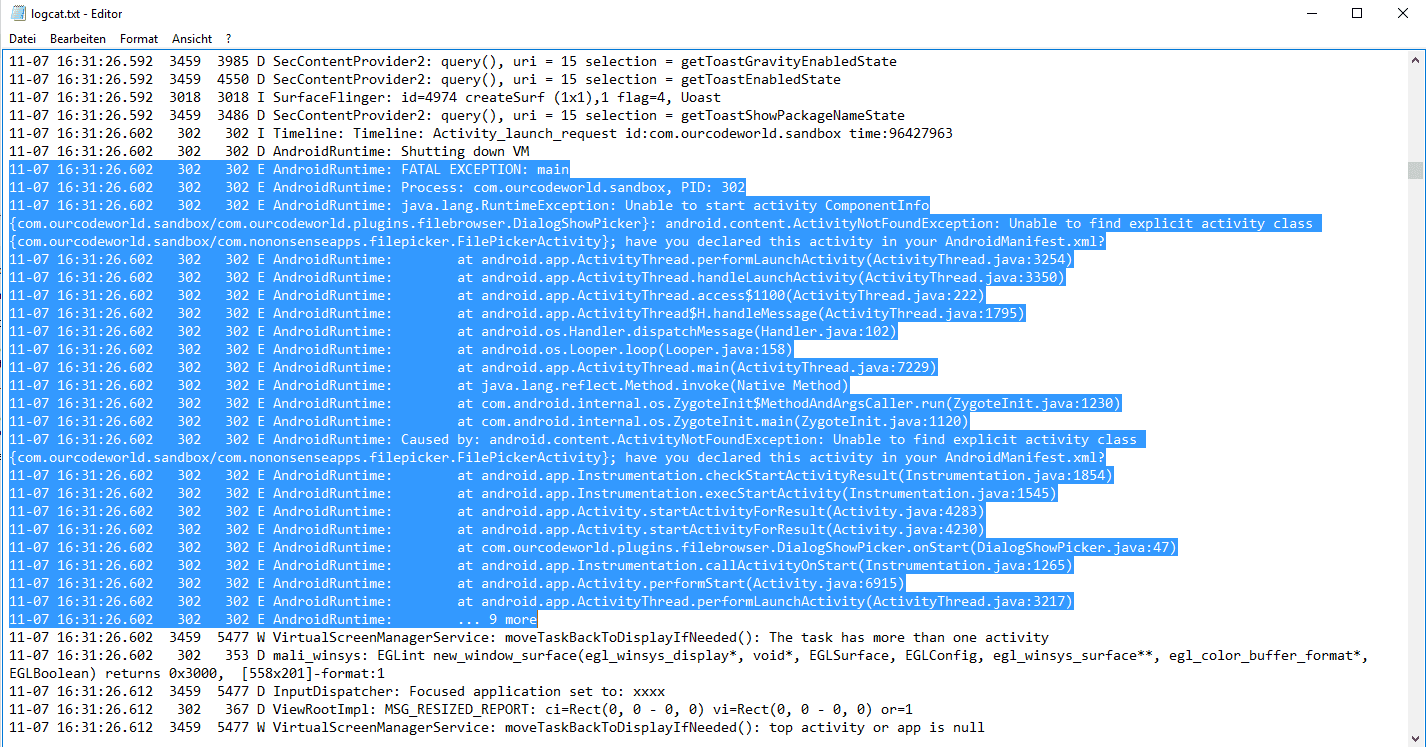
As you can see, the log.txt file give us some valuable information that we didn't have before using ADB. The error message:
Caused by: android.content.ActivityNotFoundException: Unable to find explicit activity class {com.ourcodeworld.sandbox/com.nononsenseapps.filepicker.FilePickerActivity}; have you declared this activity in your AndroidManifest.xml?
Now we know that we are calling an inexistent activity, so we just need to create it and that's it. Remember that you can filter the output generated by logcat providing parameters like -f to show only the fatal errors (read more about the logcat API in the official documentation here).
Have fun !