Although the debug on android application using Android studio (a native android app) is quite easy, debugging on a cordova application can become a big nightmare if you don't have the correct tools. You'll find that fix something on the code, compile, check on the device, check the code again, compile again and found the same error is nothing productive.
To debug a cordova application we will use the Chrome debugging tool which can be accesed in Google Chrome (desktop version).
Note
This method works to debug normal websites in Google Chrome as well.
Requirements
- Patience (In some desktop computers, set up this process can take longer)
- An Android device (with Android >= 4.4) and a USB cable
- Google Chrome (>= v.30)
- More patience
Setting up the debugging
The process consists of 3 steps :
- Enable the developer mode on your android device
- Set up inspect mode in Google chrome desktop
- Start debugging
1. Enable developer mode in android
To be able to debug your Android device with your computer, you must first enable the USB debugging in your device. This option is hidden by default and we need to make it visible, go to Android Settings > About phone (last option).
First tap 7 times on the Build Number (is the last option too), then a message that "You're a developer now will appear". Followed, go back to the settings and you will see now a new available option in the menu.

Tap on this and go to the last option (Debugging : USB Debug mode when usb is connected).

Now you'll be able to debug your cordova application on chrome.
2. Set up inspect mode in Google chrome desktop
Now that you're able to debug in your device, connect your phone to the desktop. On your device, an alert will prompts that you allow the USB debugging from your computer, tap OK.
Then navigate on Google chrome to the following url :
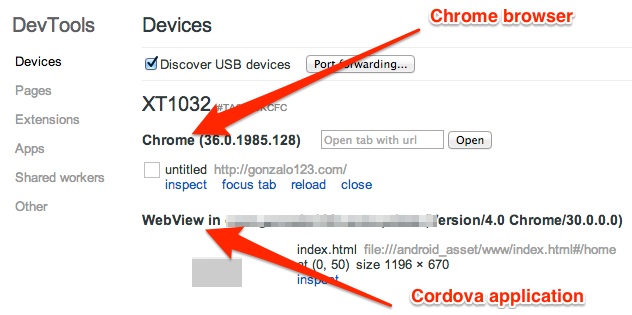
chrome://inspectYou'll get the following image if everything went right :
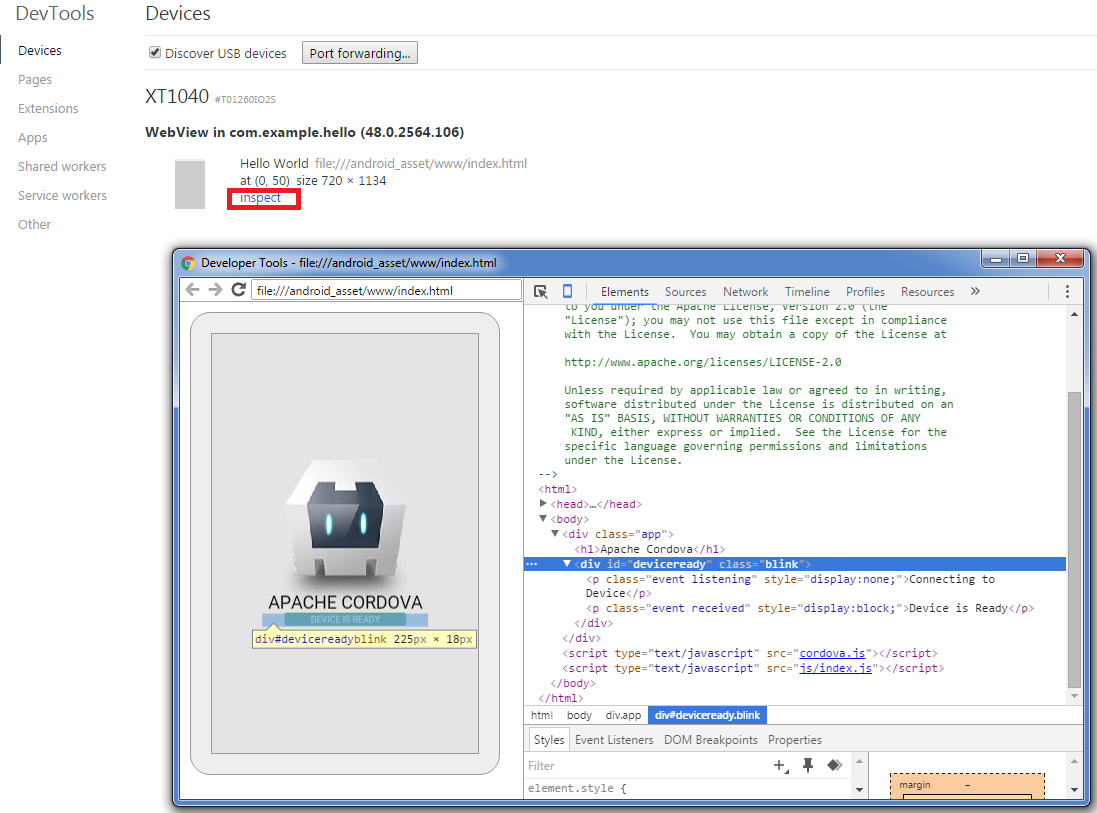
Click on inspect according to the app that you're debugging and is active on your device and inspect like you do on web projects.
3. Start debugging
Finally, debug your application without limits in the same way you do with web applications in the browser.
Important notes
Some devices requires that your desktop have the appropiated driver installed (for example if you have a Motorola , you need to download the drivers of Motorola for you desktop and then everything will work fine).
If you've already installed the drivers, and chrome://inspect still without showing any devices, then the ADB Daemon is not being started. To start the Android Debug Bridge, open a new terminal and switch to the SDK directory of Android, specifically into the platform-tools folder using the cd command:
cd C:\Users\sdkca\AppData\Local\Android\sdk\platform-toolsAnd execute the following command:
adb devicesThat should list all the connected devices in the console:
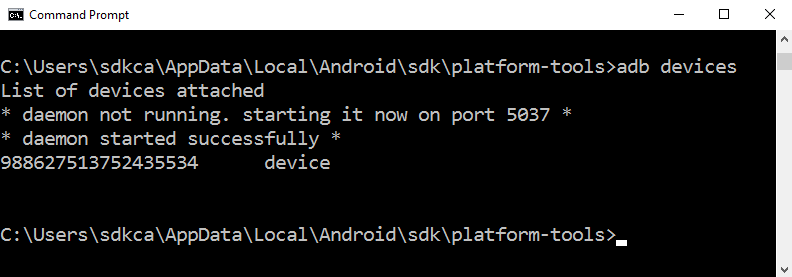
Once the devices are listed in the console, they should be now listed in chrome://inspect.