Including charts in our projects has become more easy than you think. Outside there are a lot of charting components written in javascript that will make your life easier when you want to use charts to display some information beautiful graphically instead of using html tables.
However, this task can become a serious problem for you if you end up implementing the first charting library that you find for many reasons as incompatibility with old browsers, poor documentation and limited features.
Is very important to read the documentation of all the features of a charting library before start using it on your project.
Today this top will illustrate you with 5 of the best free charting libraries for javascript.
5. Morris.js
The top begins with one of the most used charting libraries , morris.js, this library allow you to create simple charts with an easy initialization.Morris.js is the library that powers the time-series graphs. It's a very simple API for drawing line, bar, area and donut charts. Although it doesn't offers a lot of features, sometimes this is all you need to complete your daily developer tasks.
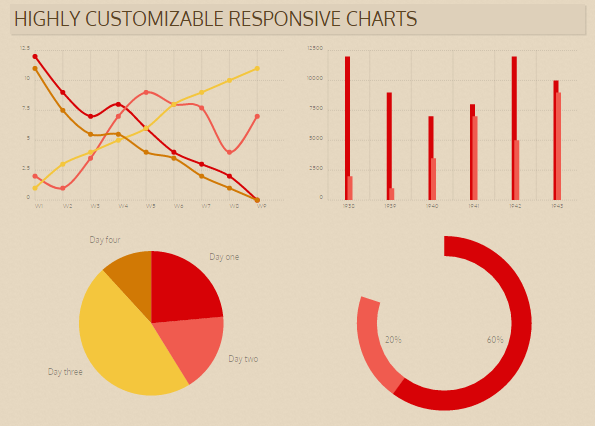
4. Chartist
Chartist offers you a complete charting library with a lot of types, is responsive and contains a lot of features that not all the available charting libraries in the web does. Chartist allows you to add plugins (a plugin which can be customized with plugin, awesome isn't?) to extend the basic functionality of your charts. You can develop your own plugins or use plugins that others have already developed.
- Simple handling while using convention over configuration
- Great flexibility while using clear separation of concerns (Style with CSS & control with JS)
- Usage of SVG
- Fully responsive and DPI independent
- Responsive configuration with media queries
- Fully built and customizable with Sass
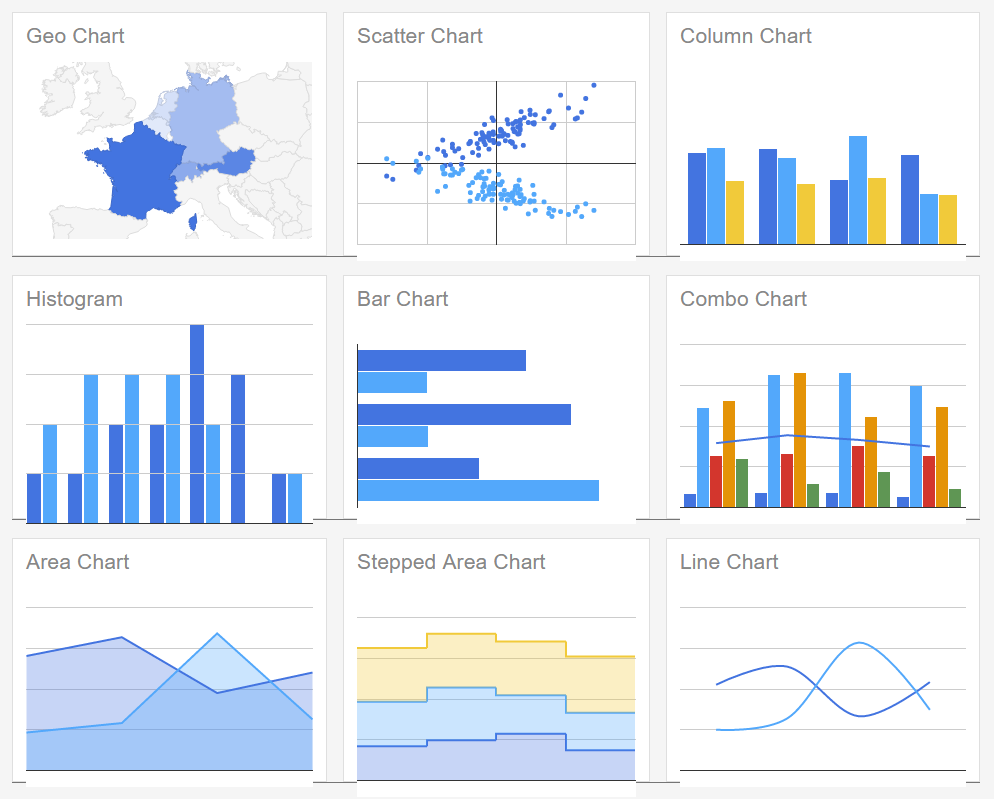
3. Google Charts
Use the same chart tools Google uses, completely free and with three years' backward compatibility guaranteed. Google chart tools are powerful and really simple to use, just read the documentation and play with the examples.
- They are customizable
- A lot of examples
- A lot of professional charts for free
2. D3
D3.js is a JavaScript library for manipulating documents based on data. D3 helps you bring data to life using HTML, SVG and CSS. D3 Is not only a charting library, you can discover more functionalities on the homepage and reading the documentation of the library.

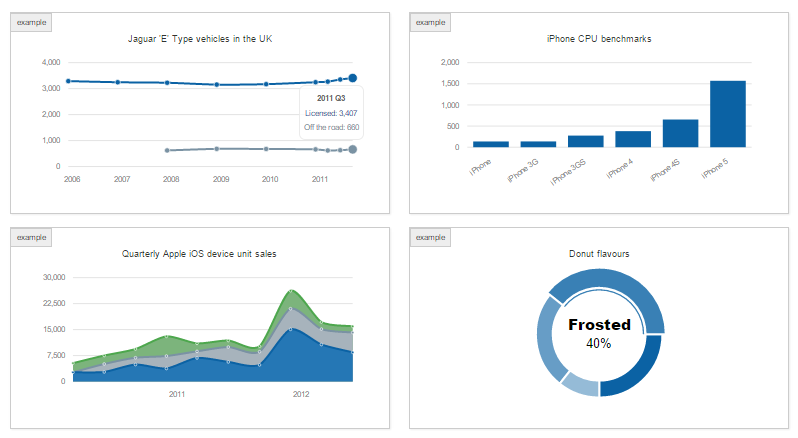
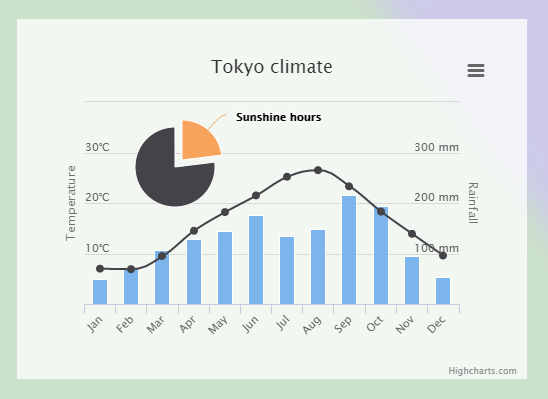
1. Highcharts
This library allows you to create interactive charts easily for your web projects. Used by tens of thousands of developers and 61 out of the world's 100 largest companies, Highcharts is the simplest yet most flexible charting javascript API on the market. Because of the multitude of functions, this is a paid library but don't worry ! If your project doesn't use highcharts for commercial purposes, you can use it for free under the Creative Commons Attribution-NonCommercial 3.0 License.
- It uses SVG
- High support crossbrowser
- Highly customizable
- A lot of charts
Highcharts have more components like Highmaps (dynamic maps with javascript) and Highstocks (more charts ...), is highly customizable have good performance and it will be very helpful in your projects. If you get stucked trying to export a chart to image in the client side check out this article, it may be useful if you require this feature.
Honorable mentions
Chart.js
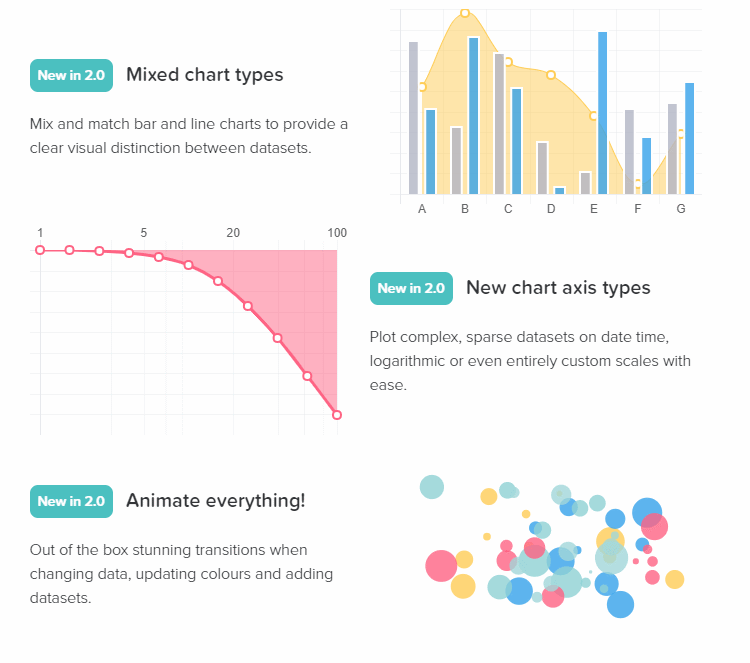
Chart.js is a simple HTML5 charting library that works with the canvas tag. You can visualize your data in 8 different ways, each of them animated and customisable.
If you think we have forgotten any other useful charting library, please share it with us in the comment box.