
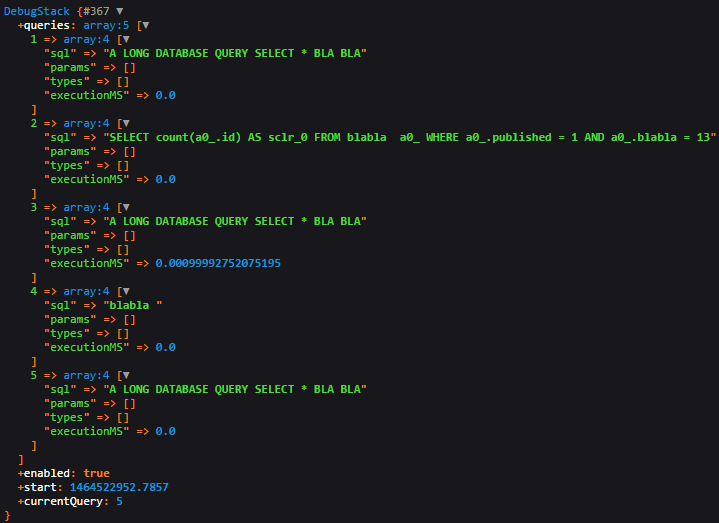
Beside the default Symfony devtools that provides detailed information about your queries, you may want to retrieve this information in order to display it to your users. Inside a custom DebugStack object, you'll find information like the time in milliseconds that took the execution of a query, the SQL query itself and some more parameters.
To get this information, you need to enable a SQLLogger into the doctrine configuration in your controllers :
class myController extends Controller
{
    public function indexAction()
    {
        // Start setup logger
        $doctrine = $this->getDoctrine();
        $doctrineConnection = $doctrine->getConnection();
        $stack = new \Doctrine\DBAL\Logging\DebugStack();
        $doctrineConnection->getConfiguration()->setSQLLogger($stack);
        $em = $doctrine->getManager();
        // End setup logger

        /**
         * Execute here all your queries
         *  $em->getRepository(...)->find(...)
         */

        return $this->render('somebundle:myBundle:index.html.twig',array(
            'stack' => $stack
        ));
    }
}
Using twig (or var_dump if you're not using twig) the dump function should output an object with the following structure :
Have fun

