
In the last days, I discovered an awesome tool namely Prometheus, the open-source systems monitoring and alerting toolkit. Prometheus collects and stores its metrics as time series data, i.e. metrics information is stored with the timestamp at which it was recorded, alongside optional key-value pairs called labels. You can then visualize this information with a tool like Grafana. Since the adoption of this tool in the company where I work right now, I started node exporter on all the servers with Ubuntu as operative system.
In this article, I will explain you step by step how to install the Node Exporter module of Prometheus in any Ubuntu 16.04, 18.04, 20.04 and 22.04 server.
1. Download Node Exporter
As first step, you need to download the Node Exporter binary which is available for Linux in the official Prometheus website here. In the website, you will find a table with the list of available builds. Of our interest in this case, is the node_exporter build for Linux AMD64:
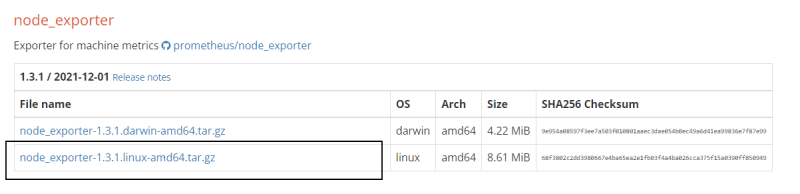
In this case the latest available version is the 1.3.1. Copy the .tar.gz URL and download it somewhere in your server using wget or cURL:
wget https://github.com/prometheus/node_exporter/releases/download/v1.3.1/node_exporter-1.3.1.linux-amd64.tar.gz2. Extract Node Exporter and move binary
After downloading the latest version of Node Exporter, proceed to extract the content of the downloaded tar using the following command:
tar xvf node_exporter-1.3.1.linux-amd64.tar.gzThe content of the zip will be extracted in the current directory, the extracted directory will contain 3 files:
- LICENSE (license text file)
- node_exporter (binary)
- NOTICE (license text file)
You only need to move the binary file node_exporter to the /usr/local/bin directory of your system. Switch to the node_exporter directory:
cd node_exporter-1.3.1.linux-amd64And then copy the binary file with the following command:
sudo cp node_exporter /usr/local/binThen you can remove the directory that we created after extracting the zip file content:
# Exit current directory
cd ..

# Remove the extracted directory
rm -rf ./node_exporter-1.3.1.linux-amd64
3. Create Node Exporter User
As a good practice, create an user in the system for Node Exporter:
sudo useradd --no-create-home --shell /bin/false node_exporterAnd set the owner of the binary node_exporter to the recently created user:
sudo chown node_exporter:node_exporter /usr/local/bin/node_exporter4. Create and start the Node Exporter service
The Node Exporter service should always start when the server boots so it will always be available to be scrapped for information. Create the node_exporter.service file with nano:
sudo nano /etc/systemd/system/node_exporter.serviceAnd paste the following content in the file:
[Unit]
Description=Node Exporter
Wants=network-online.target
After=network-online.target

[Service]
User=node_exporter
Group=node_exporter
Type=simple
ExecStart=/usr/local/bin/node_exporter
Restart=always
RestartSec=3

[Install]
WantedBy=multi-user.target
Close nano and save the changes to the file. Proceed to reload the daemon with:
sudo systemctl daemon-reloadAnd finally enable the node_exporter service with the following command:
sudo systemctl enable node_exporterAnd then start the service:
sudo systemctl start node_exporter5. Test the Node Exporter service
As last step, access your server through the web browser at port 9100 and browse the metrics (http://your_server_ip:9100/metrics). You should get an output in the browser similar to:
# HELP go_gc_duration_seconds A summary of the pause duration of garbage collection cycles.
# TYPE go_gc_duration_seconds summary
go_gc_duration_seconds{quantile="0"} 2.5948e-05
go_gc_duration_seconds{quantile="0.25"} 2.9566e-05
go_gc_duration_seconds{quantile="0.5"} 3.0488e-05
go_gc_duration_seconds{quantile="0.75"} 3.2111e-05
go_gc_duration_seconds{quantile="1"} 0.000232387
go_gc_duration_seconds_sum 1.454063444
go_gc_duration_seconds_count 23486
# HELP go_goroutines Number of goroutines that currently exist.
# TYPE go_goroutines gauge
go_goroutines 9
# HELP go_info Information about the Go environment.
# TYPE go_info gauge
go_info{version="go1.17.3"} 1
# HELP go_memstats_alloc_bytes Number of bytes allocated and still in use.
# TYPE go_memstats_alloc_bytes gauge
go_memstats_alloc_bytes 2.365264e+06
# HELP go_memstats_alloc_bytes_total Total number of bytes allocated, even if freed.
# TYPE go_memstats_alloc_bytes_total counter
go_memstats_alloc_bytes_total 5.0367212352e+10
# HELP go_memstats_buck_hash_sys_bytes Number of bytes used by the profiling bucket hash table.
# TYPE go_memstats_buck_hash_sys_bytes gauge
go_memstats_buck_hash_sys_bytes 1.897095e+06
If you get some information at the mentioned URL, then your service has been properly configured and it's ready to be scrapped by Prometheus.
If port 9100 is unreachable
As we mentioned previously, by default the node exporter service will run on the port 9100 of your server. If after starting the service, the service is unreachable, do not forget to open the port 9100 in your Ubuntu server. If you are using UFW (Uncomplicated Firewall), you can easily open this port using the following instruction:
sudo ufw allow 9100Alternatively if you are using IPTABLES, use the following command to allow incoming traffic on that port instead:
sudo iptables -I INPUT -p tcp -m tcp --dport 9100 -j ACCEPTHappy monitoring ❤️!

