
A Heat Map Chart represents some data in a tabular format with some defined color ranges like low, average and high. It is tipically a variation of the traditional heat-map where data is on Calendar (typically Month on column and weekdays on row, every data point being a date) and colour encoding is shown using a metric of your own interest that usually varies varies by day.
If you are willing to implement such a chart in your ReactJS project, we'll show you how you can achieve it using the React Calendar Heatmap component.
1. Install React Calendar Heatmap
The React Calendar Heatmap allows you to embed an svg calendar heatmap component, inspired by the github's contribution graph. The component expands to size of container and is super configurable.
To install this component in your project, open a new terminal, switch to the directory of your project and install running the following command:
npm install react-calendar-heatmapAfter the installation you will be able to import the component in your code with react-calendar-heatmap. For more information about this component, don't forget to visit its official repository at Github here.
2. Add Default Stylesheet
As second step, you need to load the main structure of the CSS that will provide a heatmap structure to the component. You can either use a free CDN:
<!-- Main CSS of heatmap -->
<link rel="stylesheet" type="text/css" href="https://cdn.rawgit.com/patientslikeme/react-calendar-heatmap/d0a7d802/src/styles.css">
Or download a copy of the styles.css file from the repository and add it in your project either with JS (via import) or with a <link> tag.
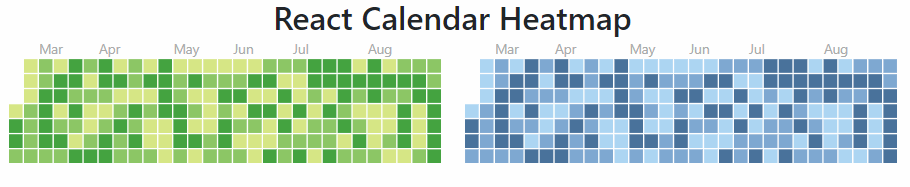
Changing heatmap colors
To define your colors for the heatmap, is necessary to add some extra CSS either by loading a new CSS file or just creating a style block in your HTML template. There are totally 4 rules that define the color of every scale:
.react-calendar-heatmap .color-scale-1 {
    fill: #d6e685;
}
.react-calendar-heatmap .color-scale-2 {
    fill: #8cc665;
}
.react-calendar-heatmap .color-scale-3 {
    fill: #44a340;
}
.react-calendar-heatmap .color-scale-4 {
    fill: #1e6823;
}
3. Implementing your first heatmap
Finally, all that you need to do to include the heatmap in your view is to import the component and provide the required properties to initialize it. As basic point, you need to provide the data that will be rendered, this data needs to be stored inside an array and every time is a literal object with a single property namely date. This date as string needs to be able to be interpreted by the Date class of JavaScript and a count property that indicates the quantity of items on the date. As well you need to provide the number of days that will be shown in the graphic, in this case we'll display an entire year (365 days). As mentioned, the chart expands to fit the parent container, so we'll wrap it inside a div of 700px of width:
import React from 'react';

// Import the calendarheatmap
import CalendarHeatmap from 'react-calendar-heatmap';

export default class App extends React.Component {

    constructor(props, context) {
        super(props, context);

        this.state = {
            // Some dates to render in the heatmap
            values: [
                { date: '2016-01-01', count: 4 },
                { date: '2016-01-22', count: 1 },
                { date: '2016-01-30', count: 3 },
                { date: new Date(2016, 0, 4)}
            ],
            // How many days should be shown
            numDays: 365
        }

        this.onClick = this.onClick.bind(this);
    }

    onClick(value) {
        console.log(value);
    }

    render() {
        return (
            <div style={{width: 700}}>
                <CalendarHeatmap
                    endDate={new Date('2017-01-01')}
                    numDays={this.state.numDays}
                    values={this.state.values}
                    onClick={this.onClick}
                />
            </div>
        );
    }
}
As result, with some dummy data the component would render a simple chart. If you are willing to test, you can make a random date generator to fill the calendar, so instead of providing an array with dates, you can provide this method as value that returns an array with dummy data:
function getDummyDates(from, to, numberDates) {
    numberDates = numberDates || 50;
    let result = [];

    for(let i = 0; i < numberDates;i++){
        result.push(
            {
                date: new Date(from.getTime() + Math.random() * (to.getTime() - from.getTime())),
                count: Math.floor(Math.random() * 6)
            }
        );
    }

    return result;
}

this.state = {
    // Some dates to render in the heatmap
    values: getDummyDates(new Date(2016, 0, 1), new Date(2017, 2, 1), 500),
    // How many days should be shown
    numDays: 365
};
The result chart would be something like:
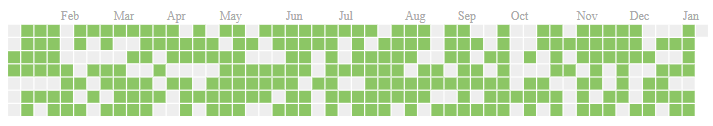
Happy coding !

