
¿Why worry about the performance in Javascript?
Measuring the time impact of Javascript code is the ideal way to identify hot spots, which is the first step in finding how to improve performance in your scripts.
In this post, we'll show you 3 ways to measure the time taken by your scripts :
- A benchmark built with Date.getTime.
- A standard way to measure with Javascript using performance.now.
- A non-standard way using console.time and console.timeEnd.
- A non-standard way using performance.mark.
However, remember that using Profiling in Firebug or Chrome Dev tools is often a far better way of finding the code that uses too much memory and keeps the browser hanging.
Old Benchmark
In the past you’d use something like Date to get a timestamp. DOMTimeStamp returns an integer number of milliseconds as its value. This achievement is not bad and works in all browsers, however doesn't provide a high range of accuracy. This solution comes in handy if you use Node.js as Performance object is not available in Node as there's not any DOM.
/**
 * Measure the time of execution with Date timestamp of a synchronous task
 *
 * @param {function} toMeasure
 * @param {int} repeatTimes
 * @return {Object}
 */
function TimeBenchmark(toMeasure,repeatTimes){
    if(typeof(repeatTimes) != "number"){
        repeatTimes = 1;
    }

    if(typeof(toMeasure) === "function"){
        var start_time = new Date().getTime();
        for (var i = 0; i < repeatTimes; ++i) {
            toMeasure.call();
        }
        var end_time = new Date().getTime();
    }

    return {
        start:start_time,
        end: end_time,
        estimatedMilliseconds: end_time - start_time
    };
}
Using Old Benchmark :
var TimesToBeExecuted = 10;
var TaskToBeExecuted = function(){
    // A task that you want to measure
};

var TestResult = new TimeBenchmark(TaskToBeExecuted,TimesToBeExecuted);
console.log(TestResult);
Standard Benchmark
In order to provide the higher accuracy needed for High Resolution time, a new type called DOMHighResTimeStamp (returned value of performance.now) was introduced. This type is a floating point value that also returns the time in milliseconds. But since it’s floating point, the value can represent fractional milliseconds, and so can yield an accuracy of one thousandth of a millisecond.
This function will measure the average execution time of your script based on X times of execution. That means that you can set how many times will be repeated this task and retrieve the average time of execution. Remember that every execution of your script doesn't take always the same time (the difference can be of a couple of milliseconds), therefore your task will be executed X times and an average time will be returned along with the total taken time.
This function relies on performance.now function and works on the following Browsers :
- IE >= 10.
- FireFox >= 15.
- Chrome >= 24.
- Safari >= 8.
- Opera >= 15.
- Android >= 4.4
/**
 * Measure the time of execution in milliseconds of a synchronous task
 *
 * @param {function} toMeasure
 * @param {int} repeatTimes
 * @return {Object}
 */
function StandardBenchmark(toMeasure,repeatTimes){
    if(typeof(repeatTimes) != "number"){
        repeatTimes = 1;
    }

    if(typeof(toMeasure) === "function"){
        var start_status = performance.now();
        var total_taken = 0;
        for(var i = 0;i < repeatTimes;i++){
            var startTimeSubtask = performance.now();
            toMeasure.call();
            var endTimeSubtask = performance.now();
            total_taken += (endTimeSubtask -startTimeSubtask);
        }
        var final_status = performance.now();
    }

    return {
        totalMilliseconds: (final_status - start_status),
        averageMillisecondsPerTask: total_taken / repeatTimes
    };
}
Use of StandardBenchmark :
var TimesToBeExecuted = 10;
var TaskToBeExecuted = function(){
// A task that you want to measure
};
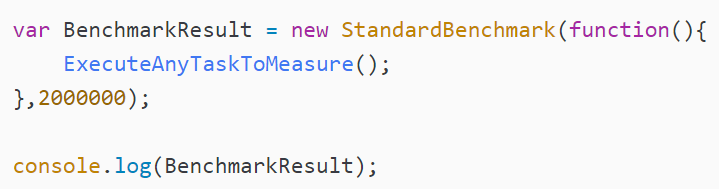
var TestResult = new StandardBenchmark(TaskToBeExecuted,TimesToBeExecuted);
console.log(TestResult);To test the StandardBenchmark function, we are going to execute a simple DOM Query using jQuery and VanillaJS. The task will be executed 10000000 (10M) times, see the following image :
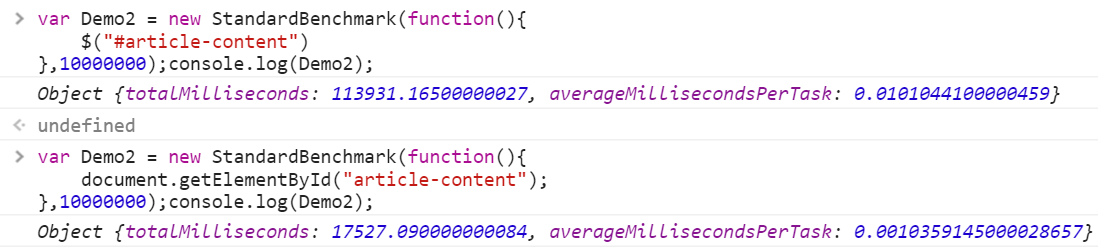
As you can see the, the first benchmark uses jQuery and takes about 113.9 seconds to be executed. Every query has an average of 0.01 Millisecond per query. By the other side, the second benchmark use VanillaJS and takes 17.5 seconds to be executed. That's about 6 times faster than the jQuery selection.
The previous benchmark has been measured using a Laptop with the following specifications :
- Windows 10 Home 64 Bits version - Chrome V 50.0.2661.102 m.
- Intel Core i5-4200U @1.60 GHz (4 CPUs).
- 4096 MB RAM.
And the same benchmark being executed on a Desktop computer with the following specifications :
- Windows 7 Ultimate 64 Bits version - Chrome V 50.0.2661.102 m.
- Intel Core i5-4590 @3.30 GHz
- 8192 MB RAM
Threw the following result :
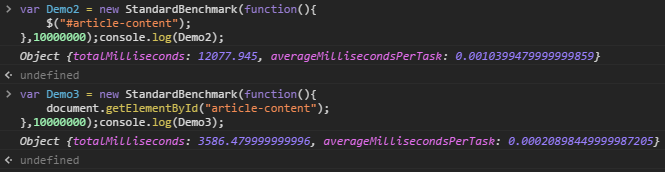
Using jQuery, every query has an average of 0.001 millisecond and the task is achieved in 12 seconds. By the other side, the second benchmark with plain javascript takes 3.5 seconds to be executed and every query takes about 0.0002 milliseconds to be completed.
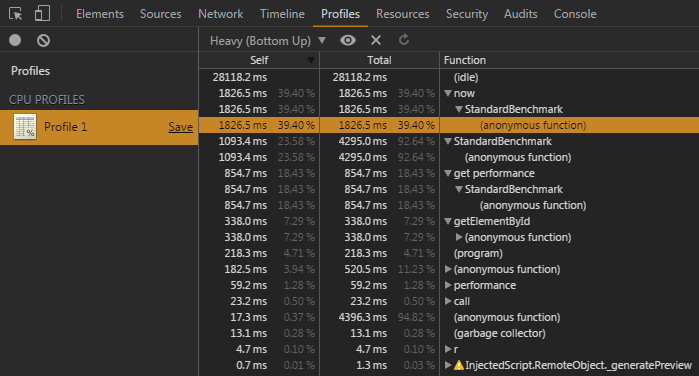
Using Browser benchmark
If you need to get a function execution time on your local development machine, you can either use your browser's profiling tools :
or console commands such as console.time() and console.timeEnd().
The console.time function expects an identifier to be set, then a timer will be started and will be finalized only using console.timeEnd with the respective identifier (previously set in console time function). You can have up to 10000 timers running on a given page i.e :
var identifier = "SelectingAdomObject";

console.time(identifier);// Start timer
// Do something
for (var i = 0; i < 10000000; ++i) {
    document.getElementById("myDomId");
}

console.timeEnd(identifier); // Stop timer and see result in the console
The result in the console should look like :
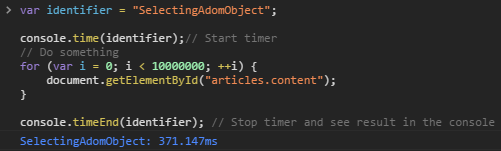
Note: console.time is non-standard and is not on a standards track, therefore do not use it on production. Only for development and test purposes.
The following function wraps the console.time feature and executes a task X times. The timer will be set outside the loop and will only determine how much time took to execute X times your task (not every time, otherwise your console would explode if the X times is too high).
function Benchmark(toMeasure,identifierName,repeatTimes){
    if(!identifierName){
        identifierName = new Date().getTime().toString();
    }

    if(typeof(repeatTimes) != "number"){
        repeat = 1;
    }

    if(typeof(toMeasure) === "function"){
        console.time(identifierName);
        for(var i = 0;i < repeatTimes;i++){
            toMeasure.call();
        }
        console.timeEnd(identifierName);
        return true;
    }

    return false;
}
Using performance.mark
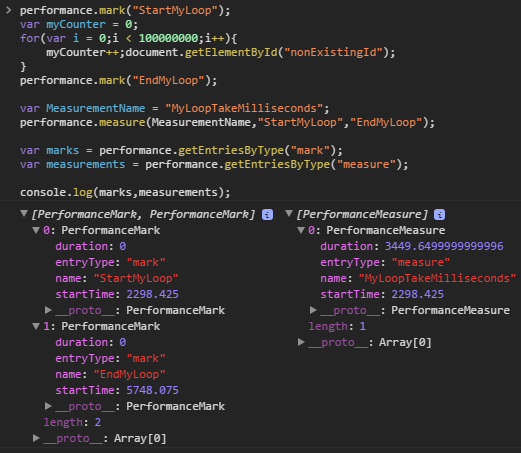
The performance.mark method is an useful timing analysis toolkit. The User Timing API provides a way that you can insert API calls at different parts of your Javascript and then extract detailed timing data that can be used to help you optimize. Mark function stores a time stamp internally in the browser. You can name the time stamp the way you want, this time stamp is as a single unit. The use of performance.mark is really simple :
performance.mark("StartMyLoop");
var myCounter = 0;
for(var i = 0;i < 10000000;i++){
    myCounter++;
    document.getElementById("NonExistingDomElement");
}
performance.mark("EndMyLoop");
Those methods will always return undefined.
Now if you want to measure how much time took the execution of your loop you should use performance.measure, this function expects as first parameter an identifier (random name), as second parameter the name of a previous set mark (start mark) and as third parameter the name of a previous set mark (end mark).
var myMeasureId = "MyLoopTakeMilliseconds";
performance.measure(myMeasureId,"StartMyLoop","EndMyLoop");
The performance.measure method is really useful as you can execute a comparison for many marks and doesn't is limited to the refered (i.e Start1, End1,Start2,End2. You can compare Start1 with End2 etc.). But, note that neither performance.measure will return anything. It will return undefined too. To get all the marks and measurements, use the getEntriesByType() method, i.e:
var marks = performance.getEntriesByType("mark");
var measurements = performance.getEntriesByType("measure");
console.log(marks,measurements);
The result of StartMyLoop, would be (5748.075 - 2298.425 = 3449.6499). Take a look at the console :
You can discard any previous mark or measurement using (respectively):
performance.clearMarks('TheNameOfMyExistingMark');
performance.clearMeasures('TheNameOfMyExistingMeasurement');
Read more about User Timing API here, have fun .

