Some of these libraries have high level support for advanced features and others present a low level drawing features, most of them open source and others with BSD license.
5. Mermaid
Mermaid is a simple markdown-like script language for generating charts from text via javascript, generating a SVG element on the DOM with the specified markdown. You can test it online using the editor here.
4. Flowchart
Flowchart draws simple SVG flow chart diagrams from textual representation of the diagram.
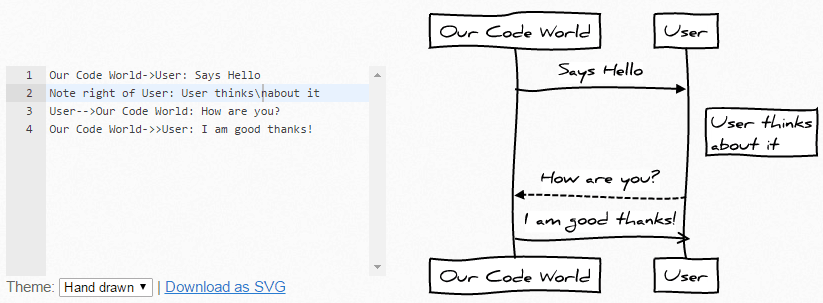
3. JS Sequence Diagrams
JS Sequence Diagrams is a simple javascript library to turn text into vector UML sequence diagrams. Heavily inspired by websequencediagrams.com, who offer a serverside solution. This plugin uses Jison to parse the text, and Raphaël to draw the image.
2. Cytoscape.js
Cytoscape.js is an open-source graph theory (a.k.a. network) library written in JavaScript. You can use Cytoscape.js for graph analysis and visualisation.
Cytoscape.js allows you to easily display and manipulate rich, interactive graphs. Because Cytoscape.js allows the user to interact with the graph and the library allows the client to hook into user events, Cytoscape.js is easily integrated into your app, especially since Cytoscape.js supports both desktop browsers, like Chrome, and mobile browsers, like on the iPad. Cytoscape.js includes all the gestures you would expect out-of-the-box, including pinch-to-zoom, box selection, panning, et cetera.
Cytoscape.js supports many different graph theory usecases. It supports directed graphs, undirected graphs, mixed graphs, loops, multigraphs, compound graphs (a type of hypergraph), and so on.
Cytoscape.js also has graph analysis in mind: The library contains many useful functions in graph theory. You can use Cytoscape.js headlessly on Node.js to do graph analysis in the terminal or on a web server. Cytoscape.js is an open-source project, and anyone is free to contribute.

1. JointJS
JointJS is a modern HTML 5 JavaScript library for visualization and interaction with diagrams and graphs. It can be used to create either static diagrams or, and more importantly, fully interactive diagramming tools such as workflow editors, process management tools, IVR systems, API integrators, presentational applications and more.
JointJS makes it easy to create visual tools of various kinds. The event-driven nature together with MVC architecture of JointJS makes it easy to plug-in any backend technology. (It is highly recommended to use the dependecies [jQuery, Backbone and Lodash] ).
- Various Shapes (Rect, Circle, Ellipse, Text, Image, Path, ERD, Org Chart, FSA, UML, BPMN, PN, DEVS, ...)
- Custom Shapes Via SVG Or Programmatically Rendered.
- Interactive Elements And Links.
- Connecting Diagram Elements With Links.
- Customizable Links, Their Arrowheads And Labels.
- Links Smoothing (Bezier Interpolation) & Smart Routing.
- Magnets/Ports (Link Connection Points) Can Be Placed Basically Anywhere.
- Hierarchical Diagrams.
- Serialization/Deserialization To/From JSON Format.
- Highly Event Driven - You Can React On Any Event That Happens Inside The Paper.
- Tons Of Mathematical Functions Operating In 2D Space.
- SVG Library Included.
- Zoom In/Out.
- Touch Support.
- Animations.
- Filters And Gradients.
- NodeJS Support.
- Fast - Ability To Render Hundreds (Or Even Thousands) Of Elements And Links With Instant Interaction.
- Flexible Plugin System.
- MVC Architecture.
- And a Lot More.
Extra
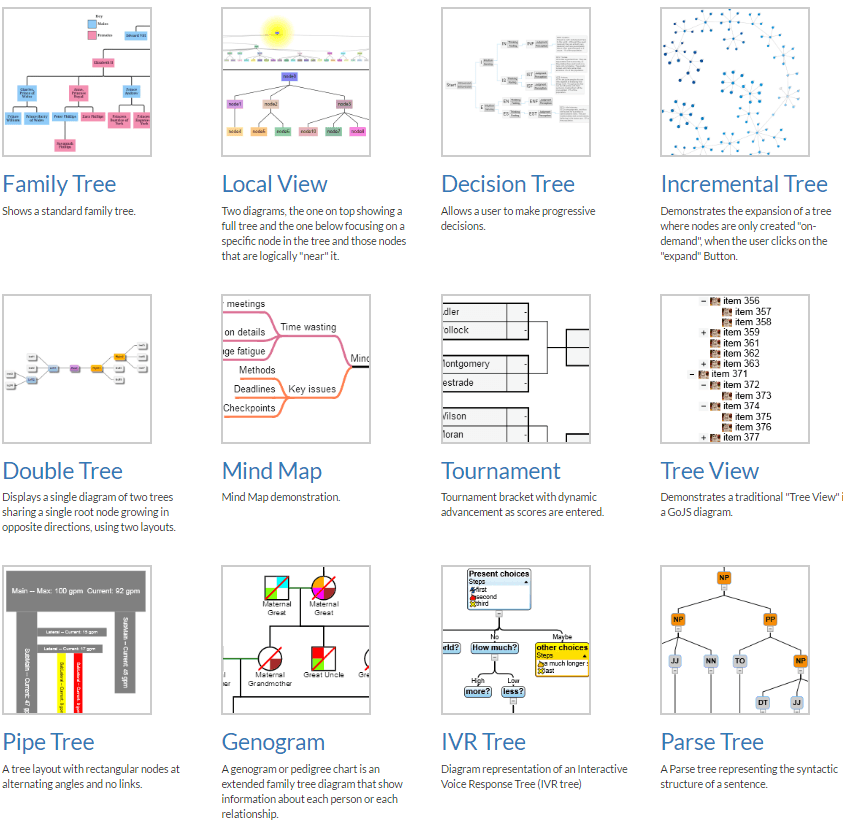
GOJs
GoJS is a feature-rich JavaScript library for implementing custom interactive diagrams and complex visualizations across modern web browsers and platforms. GoJS makes constructing JavaScript diagrams of complex nodes, links, and groups easy with customizable templates and layouts.
GoJS offers many advanced features for user interactivity such as drag-and-drop, copy-and-paste, in-place text editing, tooltips, context menus, automatic layouts, templates, data binding and models etc. Transactional state and undo management, palettes, overviews, event handlers, commands, and an extensible tool system for custom operations.
However, this is a paid library an you're limited to the evaluation period but due to its awesomeness, needs to be mentioned in this post.