
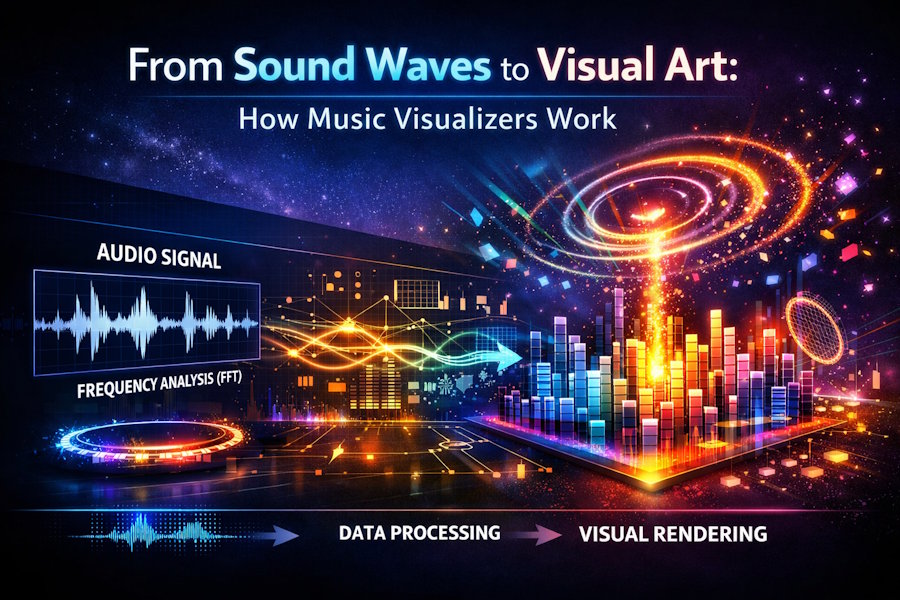
Music visualizers translate audio signals into moving graphics. What appears artistic on the surface is driven by signal processing, mathematical transforms, and real-time rendering systems. Modern visualizers sit at the intersection of audio engineering and computer graphics, converting sound waves into structured visual output with precision.
What a Music Visualizer Actually Does
At its core, a music visualizer maps changes in an audio signal to visual parameters. These parameters include motion, color, scale, rotation, and intensity. The system reacts continuously as the sound evolves.
Unlike static animation, visualizers are data-driven. Every frame depends on the incoming audio stream. The visuals are not pre-timed. They are generated dynamically based on measurable sound characteristics.
Audio Input and Signal Preparation
The process begins with audio ingestion. The audio file or live signal is sampled at a fixed rate, typically 44.1 kHz or higher. This produces a digital waveform representing air pressure changes over time.
Before analysis, the signal is often normalized and filtered. Noise reduction, channel mixing, and gain control ensure consistent input. Stereo signals may be combined or analyzed independently depending on the visualizer design.
Prepared audio data becomes the foundation for all downstream processing.
Time-Domain vs Frequency-Domain Analysis
Visualizers rely on two primary analysis domains. Each serves a different purpose.
Time-domain analysis examines the waveform directly. It tracks amplitude changes over time. This method is useful for detecting beats, transients, and overall loudness.
Frequency-domain analysis transforms the signal using a Fast Fourier Transform (FFT). This breaks the audio into frequency bands. Each band represents energy at a specific range, such as bass, mids, or highs.
Frequency analysis enables visuals to respond differently to different parts of the sound spectrum.
Feature Extraction From Sound
Once the signal is analyzed, specific features are extracted. These features drive visual behavior.
Common extracted features include:
- Overall amplitude or RMS energy
- Peak detection for beat timing
- Frequency band magnitudes
- Spectral centroid for brightness
- Temporal change rates
Each feature becomes a control signal. A bass hit may scale an object. A hi-hat may trigger particle bursts. Sustained vocals may influence color gradients.
The quality of feature extraction determines visual responsiveness.
Mapping Sound to Visual Parameters
Mapping defines how audio features influence visuals. This step separates effective visualizers from chaotic ones.
Mappings must balance sensitivity and stability. Overreaction creates jitter. Underreaction feels disconnected. Designers tune scaling curves, smoothing filters, and thresholds to maintain coherence.
Common mapping relationships include:
- Bass energy → object scale or pulse
- Mid frequencies → rotational motion
- High frequencies → particle density or sparkle
- Amplitude → brightness or opacity
Well-designed mappings preserve rhythm and structure without overwhelming the viewer.
Rendering Engines and Real-Time Graphics
Once parameters are calculated, visuals are rendered. Most modern visualizers use GPU-accelerated rendering. Shaders process geometry, color, and lighting in parallel.
Real-time systems must maintain frame rates while responding to audio input. This requires efficient pipelines. Latency must be low. Visual response must feel immediate.
Some platforms offer prebuilt frameworks that abstract this complexity. For readers looking to explore technical examples of music visualizers and real-time audio-reactive rendering, click here to review a practical reference from Videobolt.
Procedural vs Template-Based Visualizers
Procedural visualizers generate visuals entirely from code. Shapes, motion paths, and effects are calculated mathematically each frame. This approach offers maximum flexibility but requires technical expertise.
Template-based visualizers use predefined visual structures. Audio features modify existing elements rather than creating them from scratch. This lowers the barrier to entry while preserving responsiveness.
Both approaches rely on the same underlying signal processing. The difference lies in creative control and complexity.
Synchronization and Timing Accuracy
Accurate synchronization is critical. Visuals must align with perceived rhythm, not just raw data.
Human perception of rhythm is forgiving but sensitive to lag. Visualizers compensate for processing delay by predicting beats or buffering frames. Some systems use beat-tracking algorithms to anticipate timing rather than react after the fact.
Poor synchronization breaks immersion. Precision sustains it.
Use Cases Beyond Aesthetics
Music visualizers are not limited to entertainment. They serve practical functions across industries.
Applications include:
- Live performance backdrops
- Music marketing and social media content
- Educational tools for audio analysis
- Therapeutic and meditative environments
In each case, the visualizer enhances engagement by making sound visible.
Limitations and Design Tradeoffs
Visualizers operate under constraints. Highly complex visuals can obscure musical structure. Overly literal mappings can feel repetitive.
Designers choose which elements to emphasize. Rhythm over melody. Energy over harmony. These decisions shape viewer perception.
Technical limits also apply. Real-time processing competes for resources. Optimization is constant.
Why Visualizers Continue to Evolve
As music distribution becomes increasingly visual, visualizers fill a gap. They provide immediate visual identity without requiring full video production.
Advances in GPUs, audio analysis, and creative tooling continue to push capabilities forward. The fundamentals remain unchanged. Sound becomes data. Data becomes motion.
Music visualizers succeed because they reveal structure hidden in sound. They turn invisible waves into visible form.

