
You spent weeks building a feature, tested it thoroughly in staging, and deployed it on a Tuesday morning. By noon, your support inbox has three tickets saying the app feels sluggish. Your server uptime monitor shows green. Your error logs show nothing. And yet something is clearly wrong.
This is the gap that Application Performance Monitoring (APM) fills. It sits between "the app is running" and "the app is running well," giving developers the real-time, granular visibility they need to understand exactly how their application behaves under production conditions.
If you've heard the term APM thrown around in DevOps conversations but never been entirely sure what it covers, how it differs from basic monitoring, or whether a project like yours actually needs it, this guide answers all of that clearly and practically.
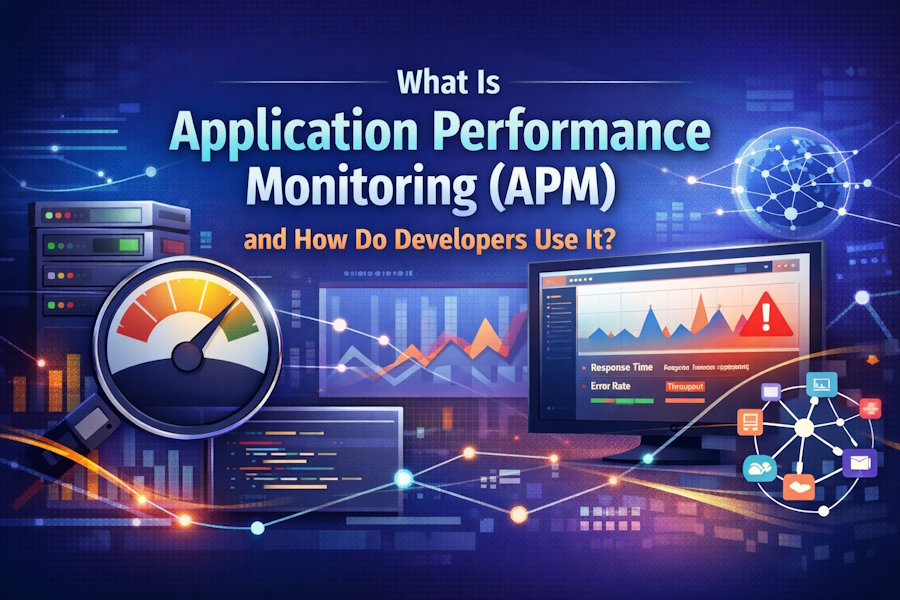
What Is Application Performance Monitoring (APM)?
Application Performance Monitoring is the continuous process of collecting, measuring, and analyzing data about how a software application performs in a live environment. Application Performance Monitoring tool instruments your application either automatically or with minimal code changes and tracks everything from individual request response times to database query durations, third-party API call latencies, error rates, and the behavior of distributed services working together.
The goal isn't just to know when something breaks. It's to understand how your application performs under real user load, where slowness originates, and why certain requests succeed while others fail or degrade.
To use a simple analogy: a smoke detector tells you there's a fire somewhere in the building. APM is the system that tells you it's specifically the second-floor kitchen, it started three minutes ago, and it's spreading toward the server room.
Uptime monitoring and basic health checks have their place, but they operate at a surface level. APM goes deeper into the internals of your running application and provides the kind of contextual data that turns a two-hour debugging session into a five-minute fix.
Modern APM tools like Middleware APM are built on open standards like OpenTelemetry, which means they can instrument applications across multiple languages and frameworks without locking you into proprietary agents or data formats.
How APM Differs From Traditional Monitoring
Developers often conflate APM with server monitoring or log analysis. They're related but serve different purposes, and understanding the distinction helps you use each one correctly.
Traditional infrastructure monitoring watches your servers, containers, and cloud resources CPU, memory, disk I/O, network throughput. It tells you when a host is unhealthy but says nothing about why your checkout endpoint is slow.
Log monitoring captures events your application explicitly writes — errors, warnings, audit trails, debug messages. Logs tell you what happened at a specific moment in time but don't automatically connect those events to the performance of user-facing requests.
APM ties everything together at the application layer. It tracks individual requests from the moment they enter your system to the moment a response is returned capturing every function call, database query, cache hit or miss, and external service call along the way. It answers the question logs and infrastructure monitoring can't: "Why is this specific request slow for this specific user?"
The most effective observability setups use all three together. APM surfaces that a request took 3.2 seconds. Logs tell you a specific function threw a warning during that request. Infrastructure metrics show you the database server was at 94% CPU at that exact time. Together, they give you the full picture.
Infrastructure monitoring watches your servers. Logs record events. APM tracks the performance of actual user requests end-to-end. You need all three working together for real production visibility.
Key Metrics APM Tools Track
Understanding what APM collects helps you know what to look for when you start using it. Here are the core signals every APM platform measures:
Response Time and Latency — How long does each request take from initiation to completion? Broken down by endpoint, this is your most direct measure of user experience. A p99 latency of 8 seconds on your login endpoint means 1 in 100 users is waiting 8 seconds to get in — even if your average looks fine.
Error Rate — What percentage of requests are returning errors (4xx, 5xx)? A sudden spike in error rate after a deployment is almost always a regression introduced by that release.
Throughput — How many requests is your application processing per minute or second? Drops in throughput without drops in traffic suggest a bottleneck — something is slowing the pipeline down.
Distributed Traces — In microservices and modern cloud-native architectures, a single user action often triggers requests across multiple services. Distributed tracing follows that full request journey, showing you exactly how much time each service consumed and where handoffs break down.
Database Query Performance — Slow or inefficient queries are responsible for a large proportion of application performance problems. APM tools surface which queries run most frequently, which take the longest, and which are being called an unexpected number of times (the N+1 query problem is a classic culprit).
External Dependency Latency — If your application calls a payment gateway, an email service, or any third-party API, APM measures how those dependencies perform and alerts you when they become a bottleneck — even when the problem is entirely on their end.
Apdex Score — Many APM tools calculate an Apdex (Application Performance Index) score: a standardized 0–1 metric that represents how satisfied users are with response times based on a threshold you define. It's a fast, single-number health indicator for non-technical stakeholders.
The core APM metrics — response time, error rate, throughput, distributed traces, database query performance, and external dependency latency — together give you complete visibility into application health from the user's perspective.
How Developers Use APM Day-to-Day
APM isn't just a tool you turn on and forget. Here's how development and DevOps teams actively use it throughout the software lifecycle:
Debugging production issues faster — When a user reports that a specific feature is slow, APM eliminates the guesswork. You pull up the trace for that request type, see that 2.8 of the 3.1-second total is spent waiting on a single database query, and you have your answer in under two minutes. No log grepping, no hypothesis testing, no "it works on my machine."
Catching regressions immediately after deployments — Most APM platforms let you compare performance across deployment markers. If your average API response time jumps 40% after Tuesday's release, you know before users start complaining — and you know exactly which release to roll back or investigate.
Setting and enforcing performance budgets — Teams integrating APM into their CI/CD pipeline can define acceptable performance thresholds. If a pull request causes a critical endpoint to exceed its latency budget, the pipeline flags it before the code ever reaches production.
Understanding real user impact — Synthetic tests tell you how your app performs under controlled conditions. APM tells you how it performs for actual users with real network conditions, real devices, and real usage patterns. That difference matters enormously when you're trying to prioritize what to optimize.
Capacity planning and scaling decisions — APM data reveals at what load your application starts to degrade. If response times start climbing when throughput exceeds 600 requests per minute, you have a concrete data point for your infrastructure scaling strategy — not a guess.
Reducing Mean Time to Resolution (MTTR) — Studies consistently show that development teams using APM resolve production incidents significantly faster than those relying solely on logs and manual investigation. Faster resolution means less user impact and less stress for on-call engineers.
APM makes developers faster at debugging, more confident after deployments, more data-driven in capacity decisions, and more proactive about performance — all of which directly reduce the cost and frequency of production incidents.
Getting Started With APM: A Practical Step-by-Step Guide
Starting with APM is less complex than most developers expect. Here's a straightforward path to getting useful data quickly:
Step 1 — Choose a tool that supports your stack natively. Look for an APM solution with auto-instrumentation support for your language and framework — Node.js, Python, Java, Go, Ruby, PHP, and .NET are all supported by major platforms. Tools built on OpenTelemetry are particularly worth considering because they avoid vendor lock-in and work across your entire stack with standardized instrumentation.
Step 2 — Install the agent with minimal code changes. Modern APM agents are designed for fast onboarding. In most cases, installation involves adding a package and a few lines of initialization code — no restructuring of your application required. Middleware's APM agent, for example, can instrument a Node.js application in under five minutes.
Step 3 — Start with your most critical three endpoints. Don't try to monitor everything at once. Identify the three endpoints where slowness or errors would hurt users most — login, checkout, search, or whatever is central to your product — and start your monitoring there.
Step 4 — Set up alerts with meaningful thresholds. An alert that fires every time latency exceeds 200ms will create noise and get ignored. Start with realistic thresholds based on your current baseline — alert when p95 latency exceeds 2x your normal — and refine from there.
Step 5 — Connect APM to your logs and infrastructure metrics. APM in isolation is useful. APM correlated with logs and infrastructure metrics is transformational. When a trace shows a slow database call, you want to click through to the corresponding log entries and see the database server's resource utilization at that exact moment. That full-stack correlation is what turns APM from a performance dashboard into a genuine debugging superpower.
Step 6 — Build performance review into your deployment process. After each significant release, spend 15 minutes comparing APM metrics before and after. Make it a habit, not an emergency measure. Teams that do this consistently ship with more confidence and catch regressions far earlier.
Final Thoughts
Application performance monitoring has moved from a "nice to have" for large engineering teams to a baseline practice for any developer running code in production. Without it, you're debugging blind — piecing together evidence from logs and user complaints rather than looking directly at what your application is doing.
The good news is that getting started no longer requires a complex setup, a big budget, or a dedicated platform engineering team. Modern APM tools are built for fast onboarding, open standards, and teams of all sizes.
Start with your three most critical endpoints. Connect your traces to your logs. Build performance review into your deploy process. Within a few weeks, you'll wonder how you ever shipped to production without it.
Author Bio: Ila Bandhiya is a content and growth specialist at Middleware, an OpenTelemetry-native full-stack observability platform built for modern engineering teams. She writes about APM, distributed tracing, log monitoring, and developer productivity. Middleware helps teams unify their observability data logs, metrics, and traces in a single platform with transparent pricing and zero vendor lock-in.

