
Managing projects in agile or hybrid teams can be tricky. Tasks overlap, deadlines shift, and priorities change faster than we can update a spreadsheet. In practice, teams usually notice that keeping everything on track requires a tool that shows not just what needs to be done, but when and how tasks relate to each other.
Interactive Gantt charts have become a popular solution for this. They let teams map out timelines, track dependencies, and adjust plans visually - all in one place. These days, many of these tools live inside React-based web applications, which makes them interactive, flexible, and easy to integrate into dashboards, booking systems, or internal platforms that teams already use.
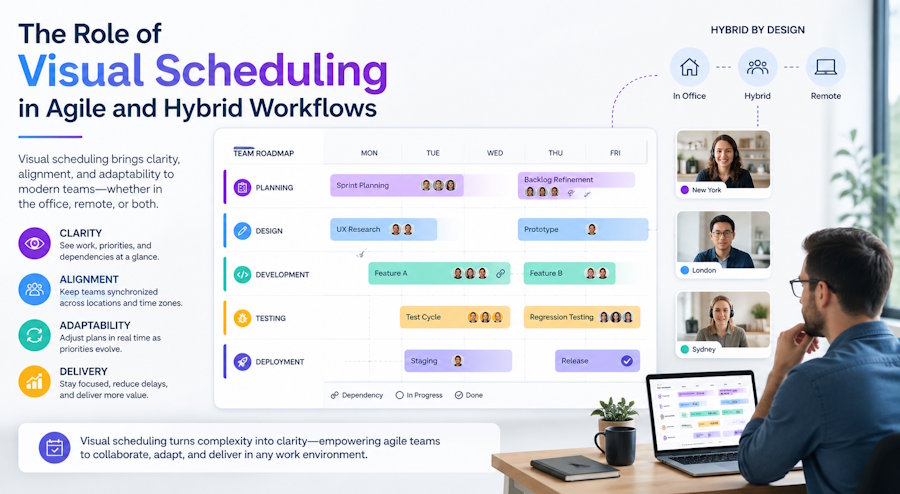
Why Visual Scheduling Matters
A task list can look perfectly fine on paper. Everything is there, neatly written down. But once the work starts, things get messy pretty quickly. Tasks overlap, priorities shift, and someone is always waiting on something else.
We’ve seen this happen even in small teams. Everyone knows what they’re responsible for, but the timing is where things fall apart. One task slips, another one gets delayed, and suddenly the whole plan feels off, even though nothing “major” went wrong.
That’s usually the point where a simple list stops being enough. You need to see how things line up over time. Not just what needs to be done, but when it’s supposed to happen and what depends on what. Once tasks are laid out on a timeline, a lot of issues become obvious almost immediately - overlaps, gaps, or just unrealistic expectations.
Think about a feature rollout. Dev work might be almost done, QA is still catching up, and marketing’s already prepping announcements. If nobody has a single view of the timeline, it’s easy for things to drift. With a visual schedule, the team can spot the gaps fast and tweak things before it turns into a mad scramble.
Gantt Charts in Agile and Hybrid Environments
At first, Gantt charts can seem a bit too structured for agile teams. If you’re used to short sprints and constant changes, a timeline view might feel like overkill. But in practice, teams usually don’t use them as rigid plans, but rather to keep things visible.
What makes a difference is how flexible modern Gantt charts have become. You’re not locking tasks into fixed dates. You’re adjusting them as things move. A feature takes longer than expected? You shift it. Something gets prioritized? You move it up. The timeline updates, and everyone immediately sees what changed.
This becomes especially useful in hybrid setups. Some people are working early, others later, and not everyone is online at the same time. Instead of explaining the plan over and over, the timeline does that job for you. You open it, and it’s clear what’s happening this week and what’s coming next.
Dependencies are another piece that teams start to appreciate over time. Not in a heavy, “project manager” sense, but in a practical one. If one task moves, you can see what else might be affected. It’s a small thing, but it saves a lot of confusion when deadlines are tight.
Why React Gantt Components Are a Smart Choice
If you look at how most internal tools are built today, a lot of them rely on React. It’s become a pretty natural choice for dashboards and data-heavy interfaces, mostly because it makes it easier to manage complex UI without everything turning into a mess.
So when teams decide to add a Gantt chart to their app, it usually makes sense to stay in the same ecosystem. Building one from scratch is possible, but it quickly turns into a bigger task than expected. Handling drag-and-drop, syncing timelines, updating dependencies - all of that adds up.
That’s why many developers end up using ready-made solutions like a React Gantt chart component. It takes care of the heavy lifting and lets you focus on how the scheduling actually fits your product. In practice, this means less time spent on low-level UI work and more time refining how the tool behaves for your users.
And the nice part is that these components don’t feel like something bolted on. When done right, they blend into the app and become just another part of the workflow, something people open, adjust, and rely on without really thinking about it.
Practical Benefits Teams Will Notice
Once a team starts working with a visual timeline, the changes aren’t dramatic at first. It’s more that planning stops feeling scattered. You’re no longer jumping between task lists and trying to piece together what happens when. Everything sits in one place.
We often notice that conversations around planning become shorter. Instead of explaining how tasks fit together, someone just opens the timeline and points things out. It’s immediately clear what’s in progress, what’s coming next, and where things might slip.
A few things tend to stand out pretty quickly:
- it is easier to see when tasks start to overlap in unrealistic ways,
- shifting one task makes the impact on the rest of the timeline visible,
- long-running work is easier to track without losing context.
None of this feels revolutionary on its own. But together, it makes planning more grounded. Teams spend less time figuring out the plan and more time actually moving it forward.
Looking Ahead: The Future of Visual Scheduling
If you look at how these tools are evolving, they’re becoming less about static planning and more about adapting on the fly. A timeline is no longer something you set once and follow. It’s something that keeps changing as the project moves forward.
We’re already starting to see small hints of that. Some tools can suggest adjustments when timelines don’t quite add up or highlight areas where things might get delayed. It’s not about handing control over to automation, but more about getting a second pair of eyes on the plan.
In practice, this changes expectations. Teams stop treating timelines as something owned by a project manager and start using them as a shared reference point. And once that happens, planning becomes less about maintaining a document and more about keeping a live picture of the work.
Final Thoughts
When teams start using a Gantt chart, the first thing they usually notice is how much easier it is to see what’s coming next. You don’t have to send ten emails just to find out if a task is on track. Everyone can glance at the timeline and know where things stand.
We often see people start adjusting their own schedules, moving tasks around to avoid conflicts, without needing a manager to tell them. It changes the way work gets done. Now, conversations happen around the chart, not in scattered messages. This works especially well in agile or hybrid workflows, where priorities shift often and teams need flexibility without losing sight of the overall plan.

