
Performance degradation on Linux rarely happens instantly. Systems usually start showing signs first: slower responses, growing backlogs, or workers who begin to lag under load. In middleware environments, those early signs spread quickly because multiple services rely on the same machine.
A restart can bring response times back to normal for a while. It does not remove whatever triggered the spike in the first place.
The following approach uses native Linux utilities to examine CPU and memory behavior in detail. The order of analysis matters, but careful interpretation matters just as much.
Understanding Resource Pressure in Linux
Linux exposes detailed system metrics. The metrics alone are not enough, however. Thus, how they are understood determines the outcome.
CPU Pressure
When CPU usage is high, the breakdown tells a story:
- User CPU (
us) reflects application execution. - System CPU (
sy) indicates kernel-level processing. - I/O wait (
wa) means processes are paused while waiting for storage or network operations.
Load average is often misunderstood as it represents runnable tasks plus tasks waiting in uninterruptible states. A high load can mean heavy computation, but it can also mean waiting.
Memory Pressure
Memory pressure develops more quietly. Common indicators include:
- Reduced
MemAvailable - Swap activity that does not stabilize
- Reclaim activity inside the kernel
- OOM termination messages
Linux aggressively uses memory for caching. High “used” memory alone does not signal danger. Pressure begins when available memory shrinks and swapping becomes consistent.
Step 1: Confirm System-Level Symptoms
System-wide metrics provide context before analyzing a specific process.
1.1 Check Load and Uptime
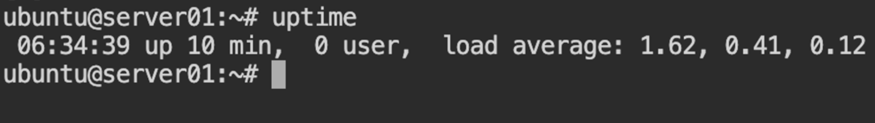
uptime
Example output:
09:37:12 up 3 days, 18:42, 2 users, load average: 2.13, 3.47, 2.98
Load should be interpreted relative to CPU core count. On a 4-core machine, sustained load above 4 suggests either CPU contention or blocked tasks. A brief spike is normal under burst traffic, but persistent elevation deserves attention.
1.2 Examine Memory Summary

free -h
The available column carries more weight than “used.” If swap usage continues to increase over time, memory pressure is present even if free memory looks reasonable.
For additional context:
cat /proc/meminfo | head -n 20
Look beyond totals. Memory distribution becomes clearer when reviewing Active, Inactive, and Slab in the output.
1.3 Observe Real-Time Activity
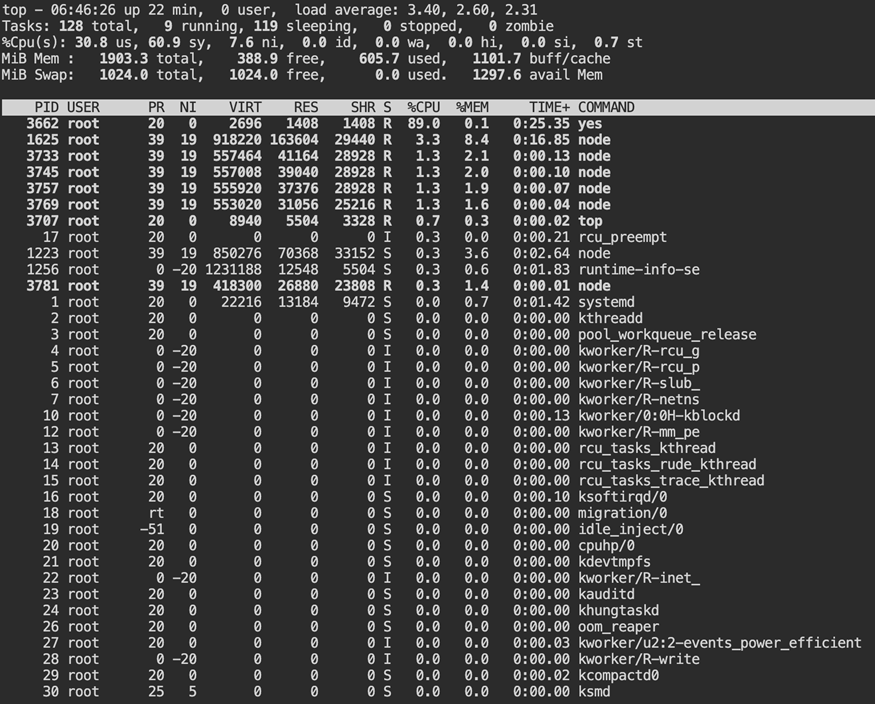
top
Do not focus only on the highest CPU process. Watch the CPU distribution line first. Check wa. That number reflects wait time on storage. Then look at sy, which represents CPU time spent inside the kernel. Do not rely on one screen update. Watch how it changes.
Step 2: Identify the Resource-Heavy Process
After confirming an elevated load, move from system metrics to the specific process behind them.
2.1 Sort by CPU Usage
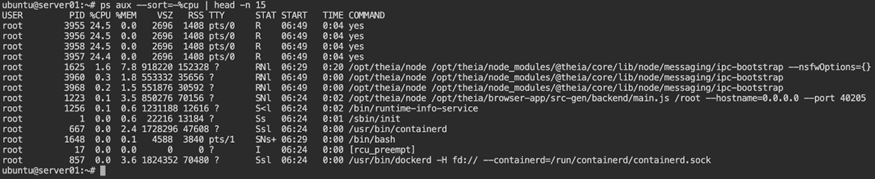
ps aux --sort=-%cpu | head -n 15
If a single process dominates CPU usage, that simplifies analysis. Distributed load across multiple worker processes requires a different approach.
2.2 Sort by Memory Usage
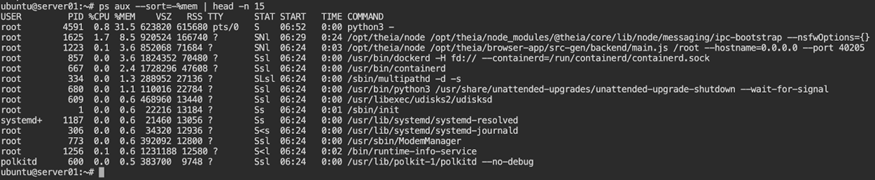
ps aux --sort=-%mem | head -n 15
Look for processes with large resident memory footprints. Gradual growth is often more concerning than a large static value.
2.3 Inspect with htop
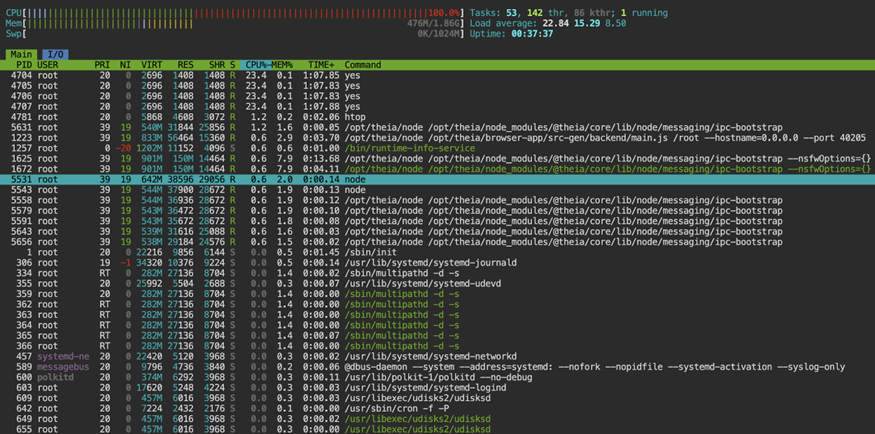
htop
If not installed:
sudo apt install htop
or
sudo dnf install htop
htop provides clearer per-core visibility. Uneven distribution across cores, however, may indicate single-thread limitations or lock contention. That said, Tree view can also reveal child processes consuming unexpected resources.
Step 3: Determine the Nature of CPU Usage
High CPU does not always explain the slowdown.
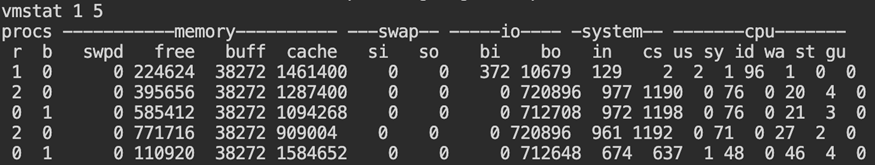
3.1 Sample with vmstat
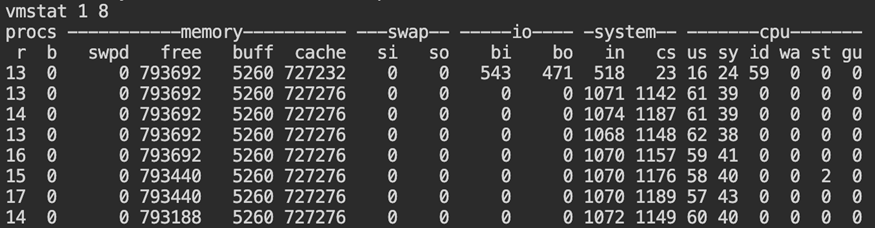
vmstat 1 10
Watch these columns:
r(runnable tasks)wa(I/O wait)siandso(swap activity)
A high r value with little I/O wait usually means the CPU is fully occupied. When I/O wait increases, the delay is often coming from storage instead. Additionally, swap activity suggests memory is influencing CPU behavior.
3.2 Review Core-Level CPU Activity
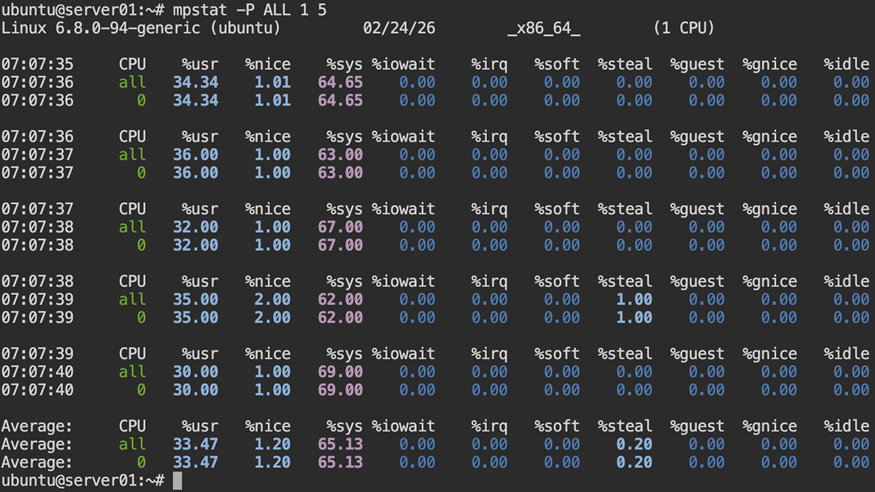
mpstat -P ALL 1 5
With multi-core hosts, you may notice a single core pinned at high usage while the rest show minimal activity. This usually suggests a task that cannot scale across threads. When all cores show sustained utilization, the application is already parallel, so scaling the same node vertically may not change the outcome.
3.3 Monitor Process-Level CPU Over Time
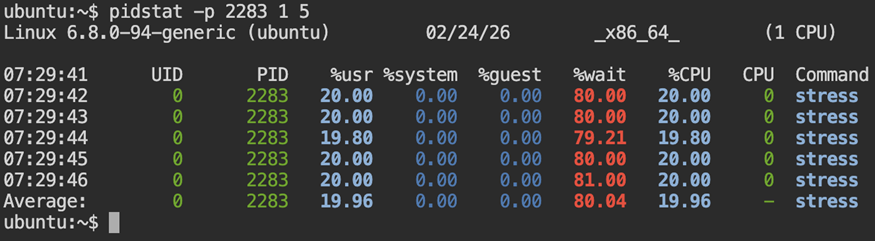
pidstat -p <PID> 1 5
Thread-level visibility:
pidstat -t -p <PID> 1 5
Repeated samples reveal whether activity is transient or sustained. Compare %usr and %wait to distinguish active execution from time spent waiting for CPU scheduling.
Step 4: Examine Memory Behavior
Memory pressure usually increases over time.
4.1 Track Memory Growth
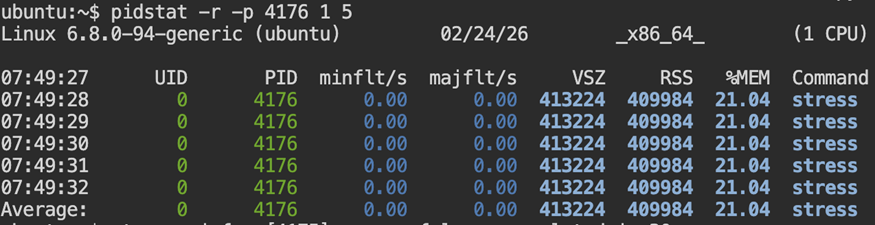
pidstat -r -p <PID> 1
Repeated samples confirm whether memory consumption is stable or growing. Compare RSS and %MEM across intervals to identify sustained allocation patterns.
4.2 Check for OOM Events
dmesg -T | grep -i -E "out of memory|oom|killed process"
When memory allocation fails at the system level, the kernel steps in and ends one of the running processes. The event is written to the kernel log, for example:
[Tue Feb 24 07:52:18 2026] Out of memory: Killed process 3421 (java) total-vm:2048000kB
That entry confirms that the system ran out of memory and recovery required terminating a workload. By the time this appears, memory pressure was already severe.
On containerized systems, behavior may differ. Memory limits enforced by cgroups can prevent allocations before system-wide exhaustion occurs. In those cases, a process may fail with allocation errors without generating a global OOM log entry.
Absence of output means no recent kernel-level OOM events were recorded.
4.3 Inspect Slab Usage
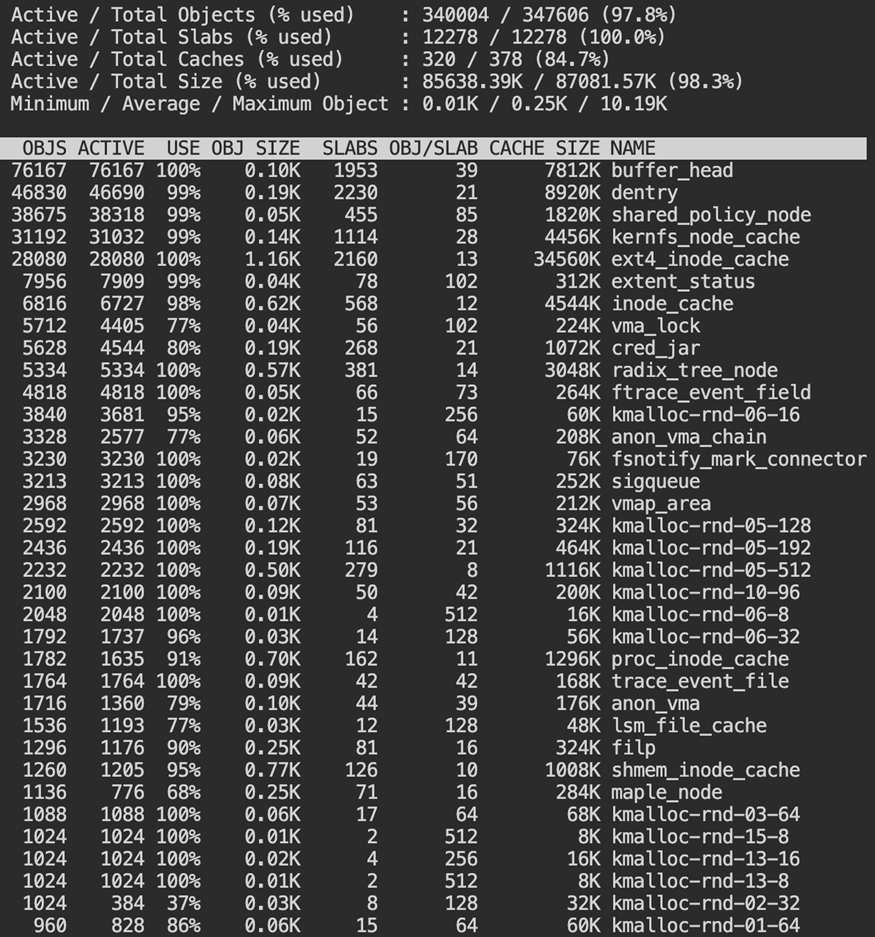
sudo slabtop
Slab memory tracks kernel-managed caches like dentries and inodes. Filesystem activity can raise slab usage even when application memory remains stable.
Step 5: Investigate Disk and I/O Bottlenecks
Disk latency can resemble CPU pressure.
5.1 Review Disk Statistics
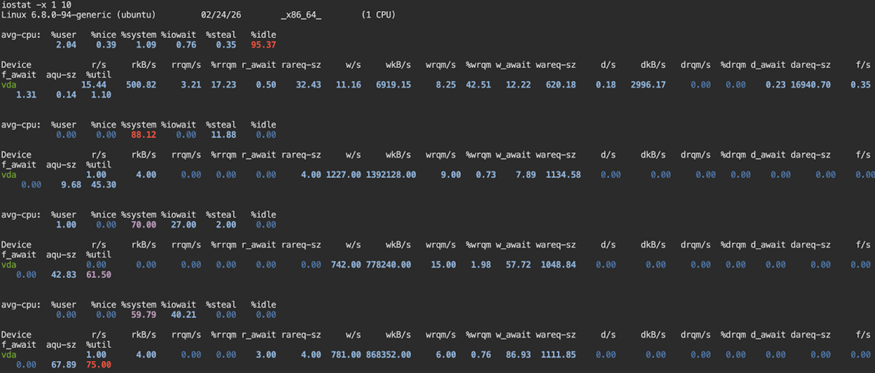
iostat -x 1 10
Watch %util. A sustained high value combined with longer await times often reflects disk pressure. Then look back at the wa value in the CPU section to confirm the impact on the system.
5.2 Monitor Swap Behavior
vmstat 1 5
Monitor si and so. Sustained values above zero signal active swapping. Even without a failure, that behavior often leads to noticeable latency and throughput loss.
Step 6: Review cgroups and Service Limits
Modern systems often enforce resource controls.
6.1 Inspect Service-Level Resource Usage
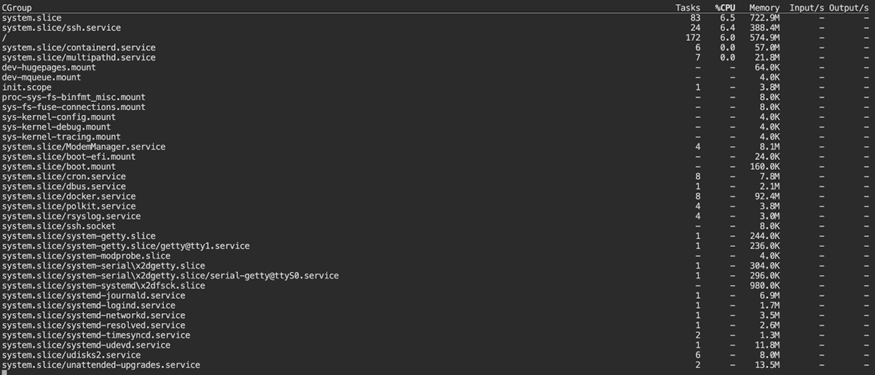
systemd-cgtop
This view aggregates resource usage by systemd control group. It shows resource usage grouped by service rather than by individual process.
6.2 Apply Resource Constraints
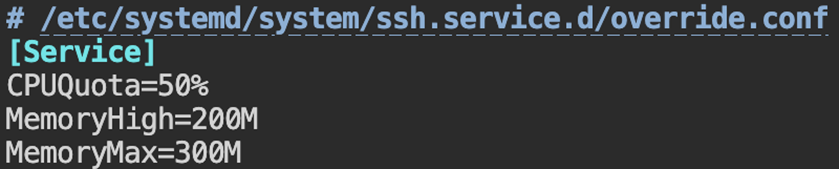
sudo systemctl edit myservice
Example configuration:
[Service]
CPUQuota=200%
MemoryHigh=2G
MemoryMax=3G
Reload:
sudo systemctl daemon-reload
sudo systemctl restart myservice
Resource caps stop a single workload from taking over the machine.
Step 7: Advanced Diagnostics
If the basic commands do not surface anything unusual, further inspection of system activity is required.
7.1 Check Pressure Stall Information
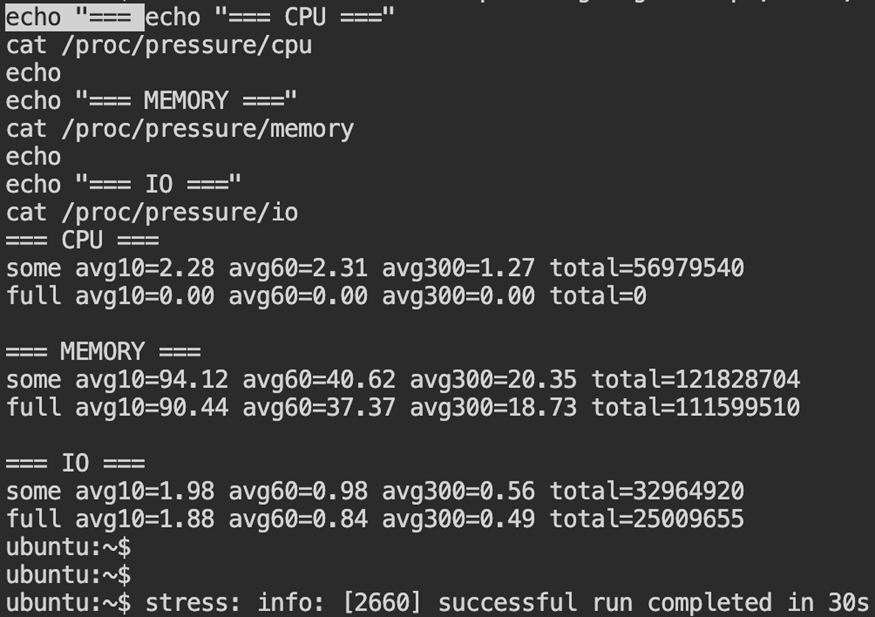
cat /proc/pressure/cpu
cat /proc/pressure/memory
cat /proc/pressure/io
The some metric shows the percentage of time at least one task was delayed due to resource contention. The full metric indicates complete stalls where all tasks were blocked. Sustained non-zero averages confirm measurable system pressure.
7.2 Trace System Calls
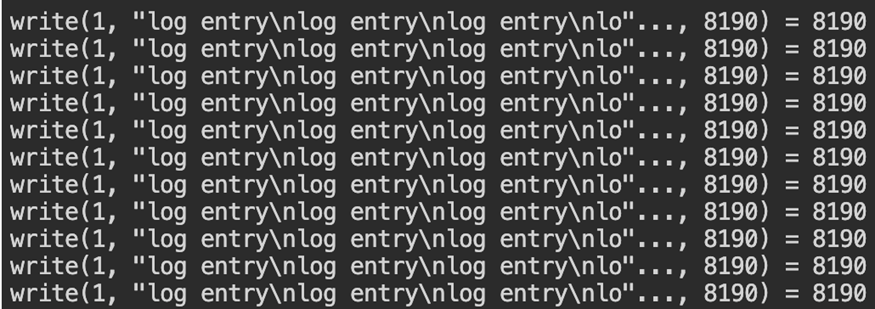
sudo strace -p <PID>
A trace dominated by write() calls usually points to heavy log activity. When futex() shows up frequently, threads are likely contending for shared resources. Use tracing briefly, as it temporarily impacts performance.
Step 8: Apply Corrective Actions
The metrics will point to a specific process. Modify that process directly rather than introducing broad configuration changes.
8.1 Restart the Service
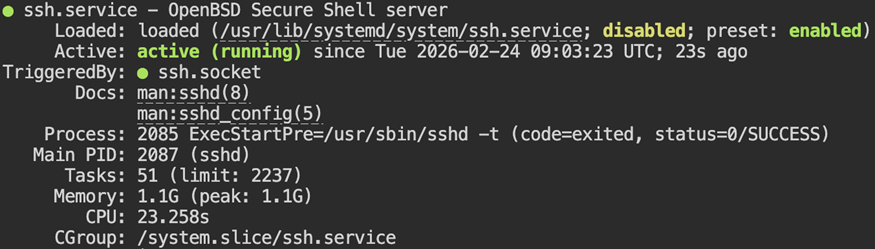
sudo systemctl restart myservice
sudo systemctl status myservice
Restarting clears transient resource spikes and reloads service state. Always verify service health immediately after a restart.
8.2 Adjust Scheduling Priority
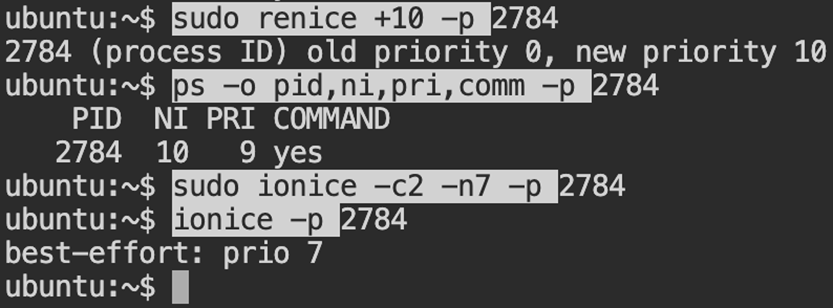
sudo renice +10 -p <PID>
sudo ionice -c2 -n7 -p <PID>
Reducing its CPU and disk priority makes the scheduler treat the process less favorably, without stopping it.
Common Middleware Root Causes
Recurring CPU and memory issues frequently stem from:
- Thread pool misconfiguration
- Excessive logging
- Memory leaks
- Unbounded caches
- Storage latency
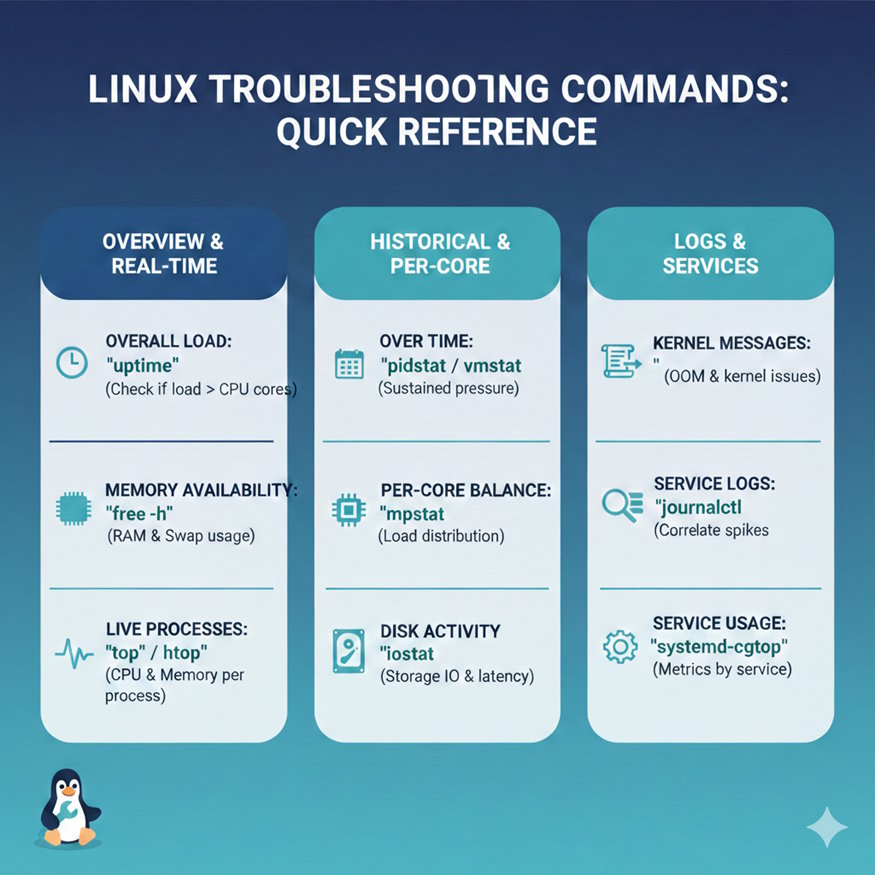
Troubleshooting Reference
Below is a quick reference for the commands discussed throughout this guide:
-
Check overall load: Use
uptimeto see whether system load exceeds available CPU cores. -
Review memory availability: Check available memory and swap behavior with
free -h. -
Monitor processes in real time:
toporhtopdisplays current CPU and memory activity. -
Sample behavior over time: Commands such as
pidstatandvmstathelp confirm whether pressure is sustained. -
Inspect per-core distribution: Use
mpstatto determine whether the load is evenly distributed. -
Evaluate disk activity:
iostatprovides visibility into storage utilization and latency. -
Check kernel messages: Use
dmesgto detect OOM events or kernel-level issues. -
Review service logs:
journalctlhelps correlate resource spikes with application events. -
Inspect service-level resource usage:
systemd-cgtopgroups metrics by service.
Monitor Linux Resource Usage Continuously
Manual diagnostics work well during active incidents. However, continuous Linux infrastructure monitoring helps surface CPU saturation, memory pressure, and disk bottlenecks before they impact users. Learn how Middleware provides unified Linux Infrastructure monitoring across servers and Kubernetes environments.
From Reactive Fixes to Proactive Monitoring
Diagnosing high CPU and memory usage requires a deliberate sequence of checks. Confirm system-level pressure first. Isolate the responsible process. Check whether the system is spending time on processing, allocating memory, or waiting on storage. Let the metrics guide the decision before adjusting configurations.
Native Linux utilities usually reveal what is consuming resources in middleware workloads.
Author Bio: Ila Bandhiya is a DevOps-focused content contributor who enjoys exploring cloud infrastructure, observability, and practical DevOps workflows. She writes to help engineers better understand concepts through clear, experience-driven explanations.

