
The debugging process in the programming world is usually tedious, not easy and take a lot of time. That's why there are many developers that focus on how to improve the development process on multiple technologies. In PHP, some people have become the idea of implementing such a debugging bar that the PHP developer can use to debug the code on the view without using var_dump, echo etc. Although many modern frameworks like Symfony, already include such a useful debugging bar (Symfony Profiler):

There are other like Laravel, Zend, Phalcon etc that doesn't offer such utility. That's why an independent library comes in handy in those cases, therefore we want to introduce you the PHP Debug Bar project.
What is PHP Debug Bar
The Debug Bar library allows you to integrate easily in any projects an useful debug bar that can display profiling data from any part of your application. It comes built-in with data collectors for standard PHP features and popular projects.
- Generic debug bar with no other dependencies.
- Easy to integrate with any project.
- Clean, fast and easy to use interface.
- Handles AJAX request.
- Includes generic data collectors and collectors for well known libraries.
- The client side bar is 100% coded in JavaScript.
- Easily create your own collectors and their associated view in the bar.
- Save and re-open previous requests.
- Very well documented.
For detailed information about this project, please visit their official website or the repository at Github. You can see a live demo in their website as well.
Installation
The library can be easily used an installed with composer using the following command:
composer require maximebf/debugbarAfter its installation you will be able to include the classes of PHP Debug bar and implement the renderer in the view.
How to use?
Rendering is performed using the DebugBar\JavascriptRenderer class. It contains all the useful functions to included the needed assets and generate a debug bar, however you can implement an standard debug bar using the StandardDebugBar class:
<?php
use DebugBar\StandardDebugBar;
$debugbar = new StandardDebugBar();
$debugbarRenderer = $debugbar->getJavascriptRenderer();
$debugbar["messages"]->addMessage("hello world!");
?>
<html>
<head>
<!-- As a good practice, load CSS etc in the head tag -->
<?php echo $debugbarRenderer->renderHead() ?>
</head>
<body>
<!-- Render the bar in the body tag -->
<?php echo $debugbarRenderer->render() ?>
</body>
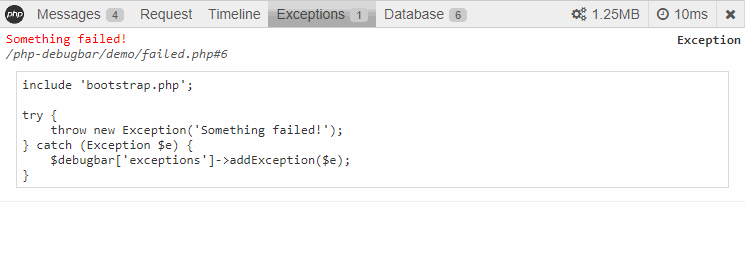
</html>The default client side implementation of the debug bar is made entirely in Javascript and is located in the debugbar.js file. It adds a bottom-anchored bar which can have tabs and indicators. The bar can be in an open or close state. When open, the tab panel is visible. An indicator is a piece of information displayed in the always-visible part of the bar. The bar handles multiple datasets by displaying a select box which allows you to switch between them. The state of the bar (height, visibility, active panel) can be saved between requests (enabled in the standard bar).
Each panel is composed of a widget which is used to display the data from a data collector. Some common widgets are provided in the widgets.js file. The PhpDebugBar namespace is used for all objects and the only dependencies are jQuery and FontAwesome (css). FontAwesome is optional but is used to add nice icons. The main class is PhpDebugBar.DebugBar. It provides the infrastructure to manage tabs, indicators and datasets. When initialized, the DebugBar class adds itself to the <body> of the page. It is empty by default.
For a more detailed implementation, we recommend you to visit the demo source code in the repository that implements the debug bar.
How to contribute?
The project is open source under the MIT license, which means that you can report issues, create pull requests on the official repository.

