
When you need to work in science topics, data visualization (or most simple, creating charts for dashboards), Pie Charts are without a doubt one of the most used and widely known ways to display simple data. Pie charts are used to display the percentage of the total of some value, so all the slices (segments) must add up to 100%. If you are willing to display this kind of Chart in your WinForms application, we recommend you to use a library for this, instead of drawing it using the Drawing classes of .NET
In this article, we'll show you how to display a Pie Chart in your WinForms application with C# using the LiveCharts library.
1. Install LiveCharts
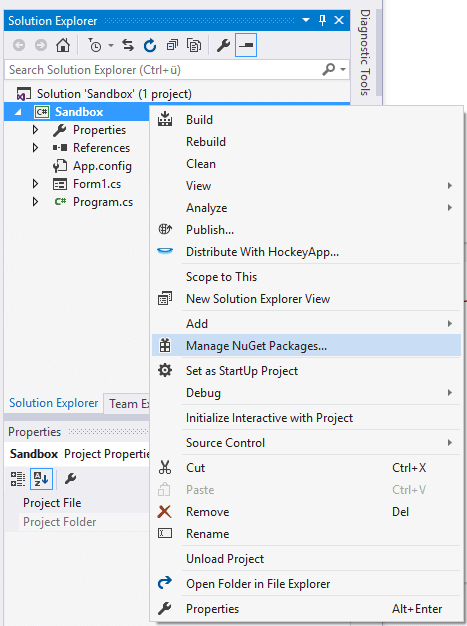
To install this package on your project in Visual Studio, go to the solution explorer and do right click on your project. From the dropdown list select the Manage NuGet Packages option:
In the Manager, go to the browse tab and search for the LiveCharts package:
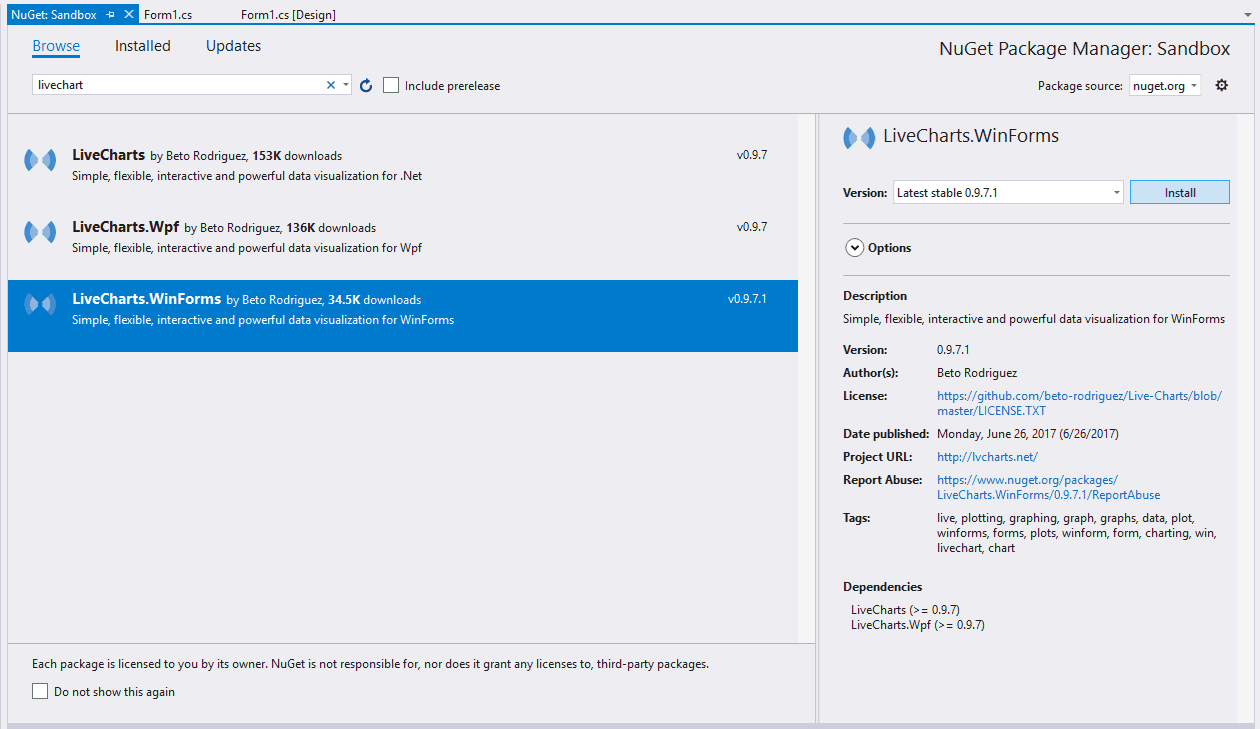
Select the WinForms package by Beto Rodriguez and install it in your project. Once the installation finishes you will be able to use the library to render charts on your code. For more information about this library, please visit the official repository at Github here.
2. Add a PieChart component
After installing the LiveCharts library in your project, automatically Visual Studio will add a new set of controls that allow you to add charts into your WinForms layout. You can find it on the left side of Visual Studio, when you open the form designer. To get started with the example of this article, we'll add a PieChart item, so just drag it and drop it into the form:

This will add the default image to let you know that the space is being occupied by this component (the data doesn't make sense). By default, the first item will be named as pieChart1 in the code, however you can change the name of the component later. In our examples, we'll keep the same name of the first element.
3. Displaying data on PieChart
Now that your form displays a PieChart graphically, you need to set some data that will be drawn. As first, you need to define a collection of data that contains PieSeries elements, these elements can be dinamically or statically defined in the SeriesCollection object. Every PieSeries object needs at least the Title, LabelPoint and Values options defined in order to be shown correctly. A value of every item can be defined with a new instance of the ChartValues class with it's type and it's primitive value.
The data on the collection can be dinamically added as necessary or defined immediately in the SeriesCollection constructor:
// Include the required namespace of LiveCharts
using LiveCharts;
using LiveCharts.Wpf;
// It's important to run the code inside the load event of the form, so the component will be drawn after this correctly
private void Form1_Load(object sender, EventArgs e)
{
// Define the label that will appear over the piece of the chart
// in this case we'll show the given value and the percentage e.g 123 (8%)
Func<ChartPoint, string> labelPoint = chartPoint => string.Format("{0} ({1:P})", chartPoint.Y, chartPoint.Participation);
// Define a collection of items to display in the chart
SeriesCollection piechartData = new SeriesCollection
{
new PieSeries
{
Title = "First Item",
Values = new ChartValues<double> {25},
DataLabels = true,
LabelPoint = labelPoint
},
new PieSeries
{
Title = "Second Item",
Values = new ChartValues<double> {25},
DataLabels = true,
LabelPoint = labelPoint
},
new PieSeries
{
Title = "Third Item",
Values = new ChartValues<double> {25},
DataLabels = true,
LabelPoint = labelPoint
}
};
// You can add a new item dinamically with the add method of the collection
// Useful when you define the data dinamically and not statically
piechartData.Add(
new PieSeries{
Title = "Fourth Item",
Values = new ChartValues<double> { 25 },
DataLabels = true,
LabelPoint = labelPoint,
Fill = System.Windows.Media.Brushes.Gray
}
);
// Define the collection of Values to display in the Pie Chart
pieChart1.Series = piechartData;
// Set the legend location to appear in the Right side of the chart
pieChart1.LegendLocation = LegendLocation.Right;
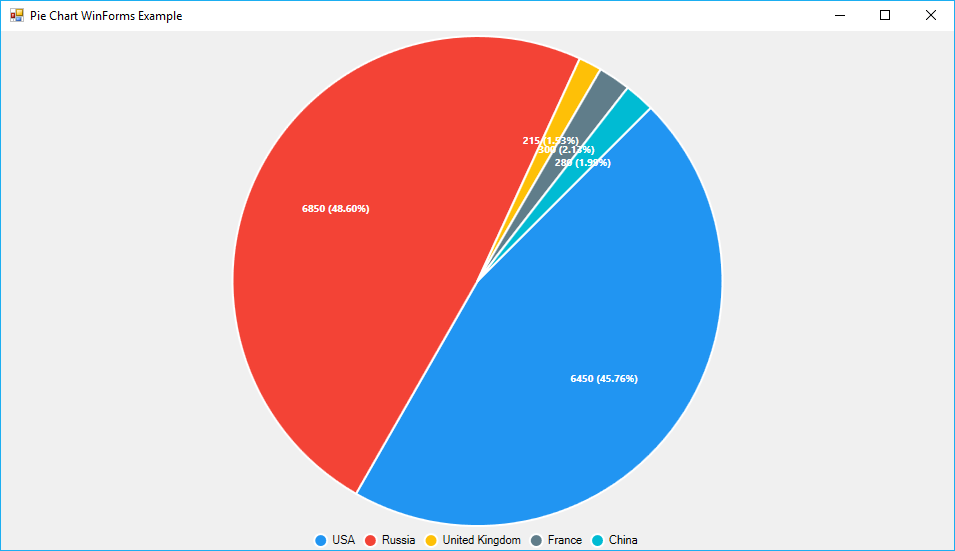
}As mentioned, the code needs to be executed after/during the form load event. The following example displays the graphic that is displayed at the beginning of the article, this shows the number and percentage of nuclear warheads of the countries:
using System;
using System.Windows.Forms;

// Include the required namespace of LiveCharts
using LiveCharts;
using LiveCharts.Wpf;

namespace Sandbox
{
    public partial class Form1 : Form
    {
        public Form1()
        {
            InitializeComponent();
        }

        private void Form1_Load(object sender, EventArgs e)
        {
            // Define the label that will appear over the piece of the chart
            // in this case we'll show the given value and the percentage e.g 123 (8%)
            Func<ChartPoint, string> labelPoint = chartPoint => string.Format("{0} ({1:P})", chartPoint.Y, chartPoint.Participation);

            // Define the collection of Values to display in the Pie Chart
            pieChart1.Series = new SeriesCollection
            {
                new PieSeries
                {
                    Title = "USA",
                    Values = new ChartValues<double> {6450},
                    DataLabels = true,
                    LabelPoint = labelPoint,

                },
                new PieSeries
                {
                    Title = "Russia",
                    Values = new ChartValues<double> {6850},
                    DataLabels = true,
                    LabelPoint = labelPoint
                },
                new PieSeries
                {
                    Title = "United Kingdom",
                    Values = new ChartValues<double> {215},
                    DataLabels = true,
                    LabelPoint = labelPoint
                },
                new PieSeries
                {
                    Title = "France",
                    Values = new ChartValues<double> {300},
                    DataLabels = true,
                    LabelPoint = labelPoint
                },
                new PieSeries
                {
                    Title = "China",
                    Values = new ChartValues<double> {280},
                    DataLabels = true,
                    LabelPoint = labelPoint
                }
            };

            // Set the legend location to appear in the bottom of the chart
            pieChart1.LegendLocation = LegendLocation.Bottom;
        }
    }
}
4. Customizing PieChart
For the customization, that almost everyone needs, are basically features. For example, to change the color, you need to define the Fill a color of the System.Windows.Media.Brushes sealed class:
new PieSeries
{
    Title = "Second Item",
    Values = new ChartValues<double> {25},
    DataLabels = true,
    LabelPoint = labelPoint,

    // Define the piece with a green color
    Fill = System.Windows.Media.Brushes.Green
}
Or if you want to highlight a piece from the Pie Chart, use the PushOut option:
new PieSeries
{
    Title = "Second Item",
    Values = new ChartValues<double> {25},
    DataLabels = true,
    LabelPoint = labelPoint,

    // Highligh this piece of the chart
    PushOut = 15,
}
The following code:
// Define the label that will appear over the piece of the chart
// in this case we'll show the given value and the percentage e.g 123 (8%)
Func<ChartPoint, string> labelPoint = chartPoint => string.Format("{0} ({1:P})", chartPoint.Y, chartPoint.Participation);

SeriesCollection piechartData = new SeriesCollection
{
    new PieSeries
    {
        Title = "First Item",
        Values = new ChartValues<double> {25},
        DataLabels = true,
        LabelPoint = labelPoint,

        // Define a custom Color
        Fill = System.Windows.Media.Brushes.Black
    },
    new PieSeries
    {
        Title = "Second Item",
        Values = new ChartValues<double> {25},
        DataLabels = true,
        LabelPoint = labelPoint,
        Fill = System.Windows.Media.Brushes.Green,
        PushOut = 15
    },
    new PieSeries
    {
        Title = "Third Item",
        Values = new ChartValues<double> {25},
        DataLabels = true,
        LabelPoint = labelPoint,
        Fill = System.Windows.Media.Brushes.Pink
    }
};

// You can add a new item dinamically with the add method of the collection
piechartData.Add(
    new PieSeries{
        Title = "Fourth Item",
        Values = new ChartValues<double> { 25 },
        DataLabels = true,
        LabelPoint = labelPoint,
        Fill = System.Windows.Media.Brushes.Gray
    }
);

// Define the collection of Values to display in the Pie Chart
pieChart1.Series = piechartData;

// Set the legend location to appear in the bottom of the chart
pieChart1.LegendLocation = LegendLocation.Right;
Would generate the following chart:

Happy coding !

