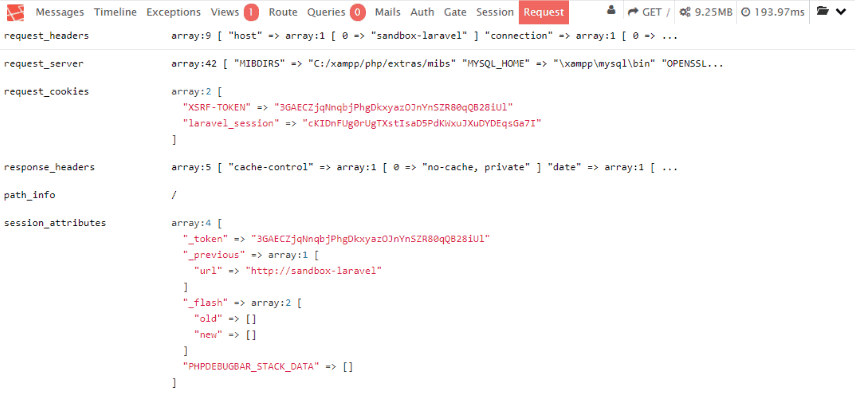
Nowadays the debugging process on many web project ain't so painful as a couple of years before, with the time improvements are made on everything to help the developer to worry about what really matters, his project and not how the technology he's using works. The Symfony Framework implements by default an useful debugging bar:

That helps you out in awful situations about problems with your database, deprecated functionalities, an extra variable dumper to dump variables on the bar to not contaminate your views and many other useful features. There are as well plain PHP libraries that implement a custom debugger like Kint, however they aren't totally suitable (they work pretty nice) for your framework because you would need to modify the way you work. If you are willing to implement such an useful bar on your Laravel Project, you can use a special project for this framework that will help you to implement the debug bar in a couple of seconds.
Note
This tutorial has been made for the version 5.4.* of laravel. The project supports however the 4.x version of Laravel, so you may want to read the project readme file in their repository.
1. Install the laravel-debugbar package
The Laravel Debugbar package allows you to implement a simple debugbar in your Laravel project with different sections. It includes a ServiceProvider to register the debugbar and attach it to the output. You can publish assets and configure it through Laravel. It bootstraps some Collectors to work with Laravel and implements a couple custom DataCollectors, specific for Laravel. It is configured to display Redirects and (jQuery) Ajax Requests.
To install this package run the following composer command:
composer require barryvdh/laravel-debugbar:~2.4As mentioned at the beginning of the article, we'll focus on the version 5.4 version of Laravel, so you need to use the version 2.4 of the library. For more information about this library, please visit the official repository at Github here.
2. Register the service provider and alias
After the installation of the library, you will be able to use its classed through the autoloader of composer. Register the service provides of the debug bar in the your-project/config/app.php file in the providers property of the returned array. If you want, you can register an alias for the debugger class so you can add messages to the debug bar in the same file:
<?php

return [
    /* Rest of app.php */

    'providers' => [
        // Register Debug Bar Service Provider
        Barryvdh\Debugbar\ServiceProvider::class,
    ],

    /* Rest of app.php */

    'aliases' => [
        // Register Debugbar alias
        'Debugbar' => Barryvdh\Debugbar\Facade::class,
    ],
];
3. Using the debugbar
The profiler is enabled by default, if you have APP_DEBUG=true. You can override that in the config (debugbar.enabled) or by setting DEBUGBAR_ENABLED in your .env. See more options in config/debugbar.php You can also set in your config if you want to include/exclude the vendor files also (FontAwesome, Highlight.js and jQuery). If you already use them in your site, set it to false. You can also only display the js or css vendors, by setting it to 'js' or 'css'. (Highlight.js requires both css + js, so set to true for syntax highlighting). To test it, you can try to use the debug method of Laravel and then add a message to the logger with the Debug bar to display it in case it doesn't show up:
<?php

namespace App\Http\Controllers;

use Illuminate\Http\Request;
use Debugbar;

class DefaultController extends Controller
{
    /**
    * Index route
    *
    * @return Response
    */
    public function index()
    {
        dump("Hello !");

        Debugbar::info("Hello World !");

        // Do what you need to do with the data of the request
        return view('default', array(

        ));
    }
}
Happy coding !


