
Although this is not always necessary on applications that use Google Maps to display addresses or something related, some clients do want to highlight some area, city or country. In this article, we'll explain 2 ways to highlight some City, State or Country with JavaScript.
Short description about what you are going to do
To achieve this, you will basically need to look for the coordinates of the state or country on GADM. Once you have them, draw a shape on the Google Maps with the Polygon object providing an array with all the coordinates that play basically as borders of the place that you want to highlight.
Important: Retrieve geographic coordinates of the City, State or Country
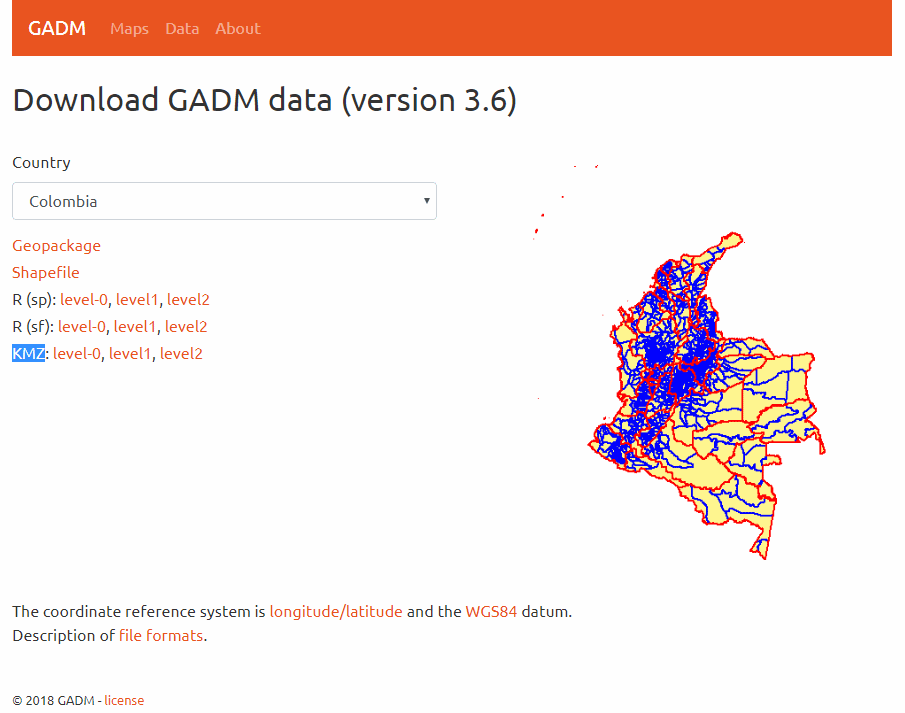
The most important point of this tutorial is of knowing the geographic coordinates of the borders-limits of the area that you want to highlight. With Google Maps, you will be unable to get such information from this tool, instead we recommend you an easier way to get them through the GADM utility. In the GADM website, you will be able to download KZM data about entire countries, so you will be able to highlight Countries, States or Cities according to your needs.
From the download website you will need to download the KZM data and according to your needs, you will have 3 levels available (and in almost all the cases the color description corresponds to):
Note
We are going to follow this tutorial with Colombia as the Country and we are going to draw the city of Bucaramanga.
- level-0: corresponds to the coordinates of the entire country (outside red area)
- level1: corresponds to the coordinates of inner states (inside red areas)
- level2: corresponds to the coordinates of cities, communities (inside blue areas)
The data at GADM are freely available for academic use and other non-commercial use. Redistribution, or commercial use, is not allowed without prior permission. Using the data to create maps for academic publishing is allowed.
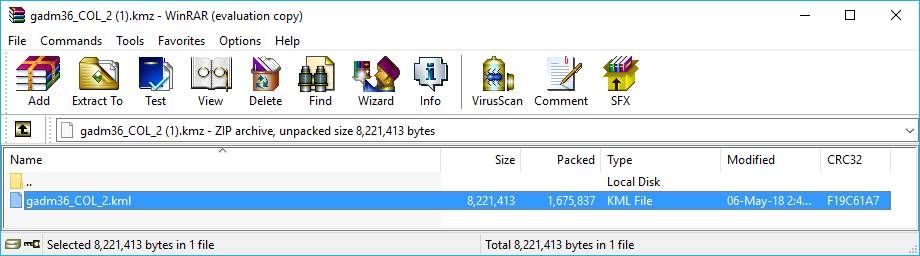
After downloading the level that you need (in our case we have the level2 from which we can retrieve the coordinates of cities), you will need to extract the content of the KMZ file (in our case the file is gadm36_COL_2.kmz) with a tool like WinRar or 7zip, inside you will find a KML file (in our case gadm36_COL_2.kml):
Then, open the kml file with a text editor and you will find basically an XML structure of data:
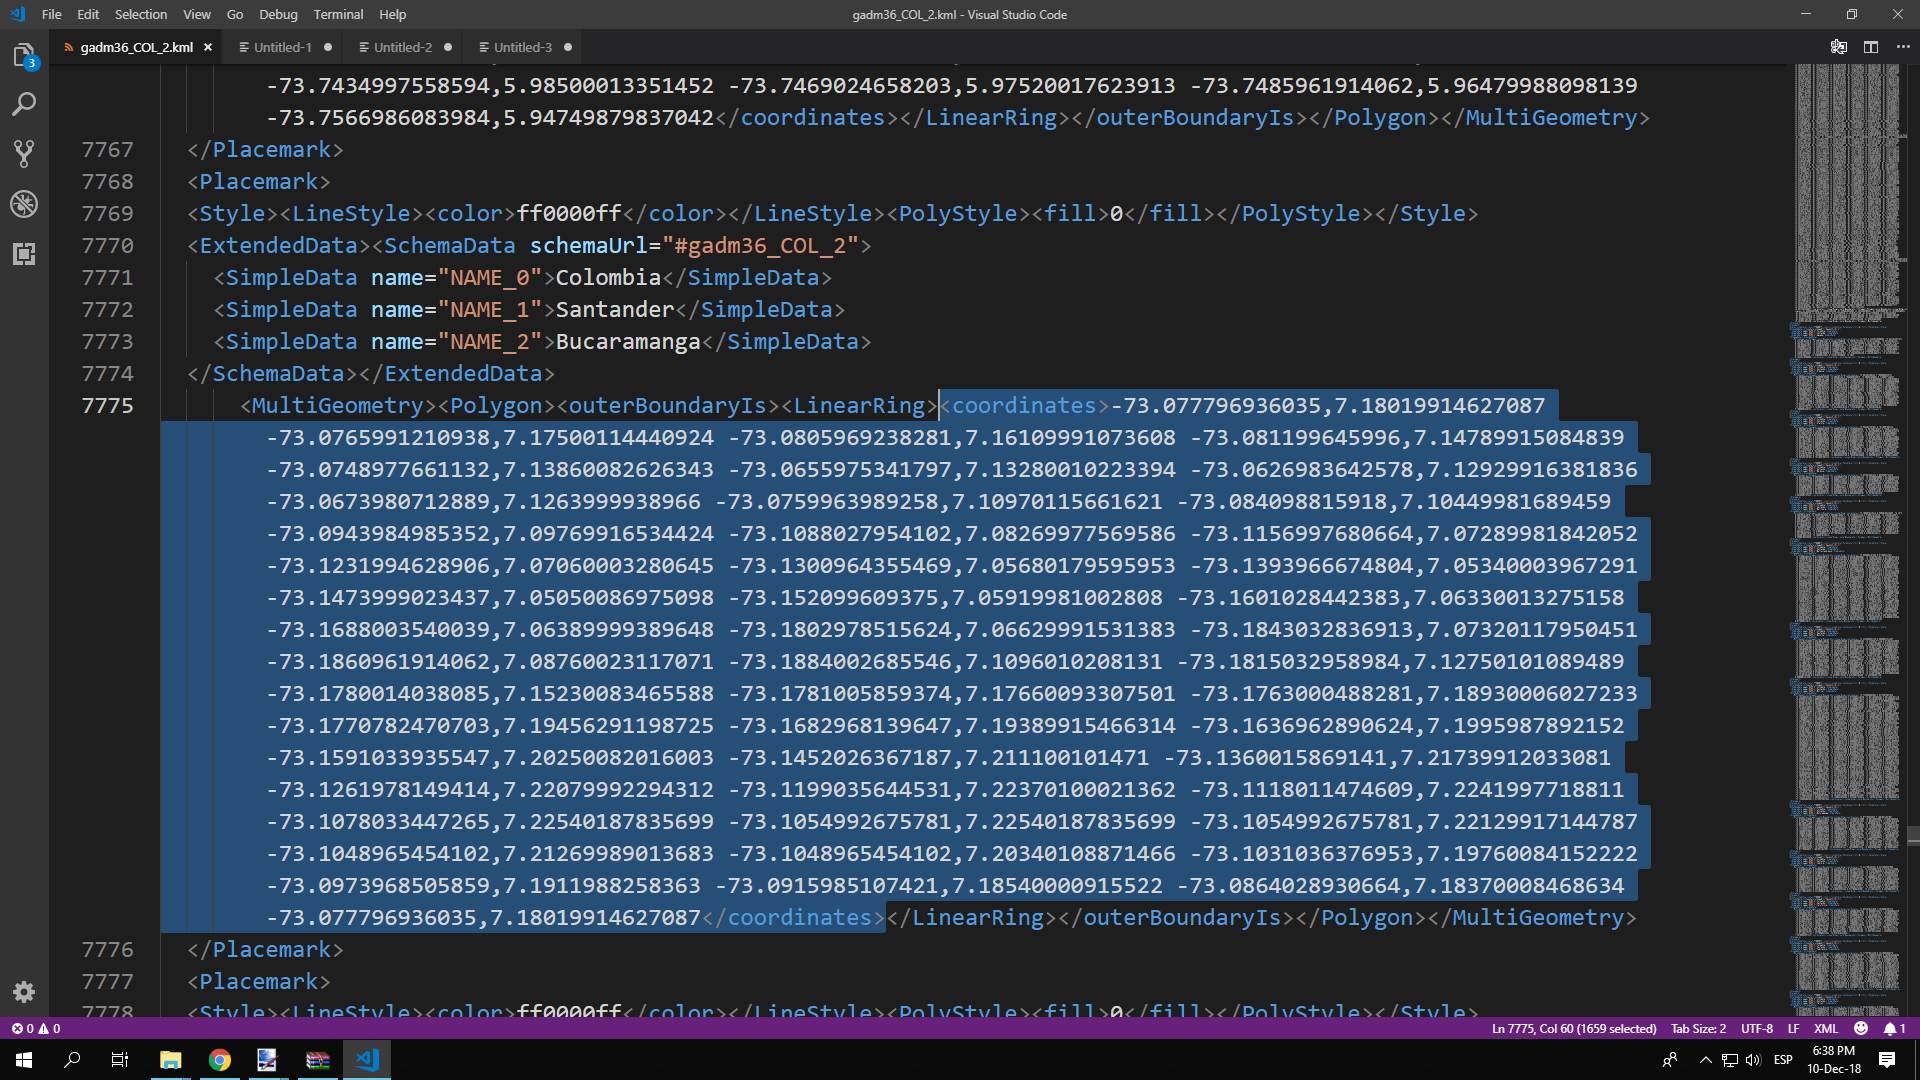
Now what you have to do is to search for your State or City that you want to highlight on Google Maps. In our case we are looking for the coordinates of the beautiful city of Bucaramanga in Colombia. After searching on the file content, you will find the coordinates of the State/City in the Longitude and Latitude format (first lng and then lat). For example, the coordinates of the Bucaramanga City according to the GADM database are (lng and lat):
-73.077796936035,7.18019914627087
-73.0765991210938,7.17500114440924
-73.0805969238281,7.16109991073608
-73.081199645996,7.14789915084839
-73.0748977661132,7.13860082626343
-73.0655975341797,7.13280010223394
-73.0626983642578,7.12929916381836
-73.0673980712889,7.1263999938966
-73.0759963989258,7.10970115661621
-73.084098815918,7.10449981689459
-73.0943984985352,7.09769916534424
-73.1088027954102,7.08269977569586
-73.1156997680664,7.07289981842052
-73.1231994628906,7.07060003280645
-73.1300964355469,7.05680179595953
-73.1393966674804,7.05340003967291
-73.1473999023437,7.05050086975098
-73.152099609375,7.05919981002808
-73.1601028442383,7.06330013275158
-73.1688003540039,7.06389999389648
-73.1802978515624,7.06629991531383
-73.1843032836913,7.07320117950451
-73.1860961914062,7.08760023117071
-73.1884002685546,7.1096010208131
-73.1815032958984,7.12750101089489
-73.1780014038085,7.15230083465588
-73.1781005859374,7.17660093307501
-73.1763000488281,7.18930006027233
-73.1770782470703,7.19456291198725
-73.1682968139647,7.19389915466314
-73.1636962890624,7.1995987892152
-73.1591033935547,7.20250082016003
-73.1452026367187,7.211100101471
-73.1360015869141,7.21739912033081
-73.1261978149414,7.22079992294312
-73.1199035644531,7.22370100021362
-73.1118011474609,7.2241997718811
-73.1078033447265,7.22540187835699
-73.1054992675781,7.22540187835699
-73.1054992675781,7.22129917144787
-73.1048965454102,7.21269989013683
-73.1048965454102,7.20340108871466
-73.1031036376953,7.19760084152222
-73.0973968505859,7.1911988258363
-73.0915985107421,7.18540000915522
-73.0864028930664,7.18370008468634
-73.077796936035,7.18019914627087
These are the coordinates that you need to highlight the are that you want, however there are 2 ways to do it, using a KmlLayer or a Polygon in Google Maps. We'll explain how to do it in both ways:
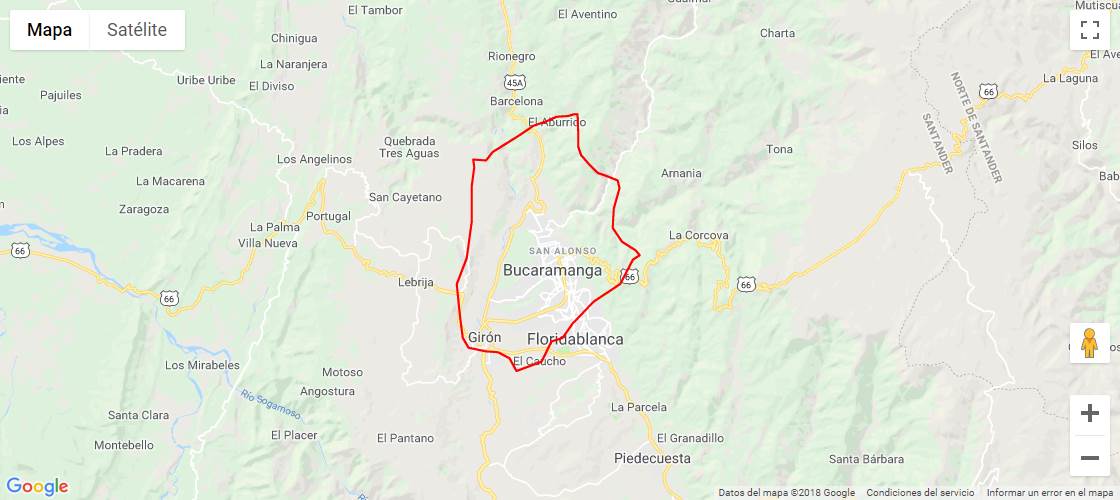
A. Drawing a Polygon
If you choose the Polygon way, you will need to build an array of coordinates to draw on your map. You will need to get the coordinates from the important point of this article and then build your own array of coordinates for example:
// Initialize some map with center at Bucaramanga
var map = new google.maps.Map(document.getElementById('marker-map'), {
center: {
lat: 7.119082288502541,
lng: -73.120029012106
},
zoom: 13,
mapTypeId: 'roadmap'
});
// An array with the coordinates of the boundaries of Bucaramanga, extracted manually from the GADM database
var BucaramangaDelimiters = [
{ lng: -73.077796936035, lat: 7.18019914627087 },
{ lng: -73.0765991210938, lat: 7.17500114440924 },
{ lng: -73.0805969238281, lat: 7.16109991073608 },
{ lng: -73.081199645996, lat: 7.14789915084839 },
{ lng: -73.0748977661132, lat: 7.13860082626343 },
{ lng: -73.0655975341797, lat: 7.13280010223394 },
{ lng: -73.0626983642578, lat: 7.12929916381836 },
{ lng: -73.0673980712889, lat: 7.1263999938966 },
{ lng: -73.0759963989258, lat: 7.10970115661621 },
{ lng: -73.084098815918, lat: 7.10449981689459 },
{ lng: -73.0943984985352, lat: 7.09769916534424 },
{ lng: -73.1088027954102, lat: 7.08269977569586 },
{ lng: -73.1156997680664, lat: 7.07289981842052 },
{ lng: -73.1231994628906, lat: 7.07060003280645 },
{ lng: -73.1300964355469, lat: 7.05680179595953 },
{ lng: -73.1393966674804, lat: 7.05340003967291 },
{ lng: -73.1473999023437, lat: 7.05050086975098 },
{ lng: -73.152099609375, lat: 7.05919981002808 },
{ lng: -73.1601028442383, lat: 7.06330013275158 },
{ lng: -73.1688003540039, lat: 7.06389999389648 },
{ lng: -73.1802978515624, lat: 7.06629991531383 },
{ lng: -73.1843032836913, lat: 7.07320117950451 },
{ lng: -73.1860961914062, lat: 7.08760023117071 },
{ lng: -73.1884002685546, lat: 7.1096010208131 },
{ lng: -73.1815032958984, lat: 7.12750101089489 },
{ lng: -73.1780014038085, lat: 7.15230083465588 },
{ lng: -73.1781005859374, lat: 7.17660093307501 },
{ lng: -73.1763000488281, lat: 7.18930006027233 },
{ lng: -73.1770782470703, lat: 7.19456291198725 },
{ lng: -73.1682968139647, lat: 7.19389915466314 },
{ lng: -73.1636962890624, lat: 7.1995987892152 },
{ lng: -73.1591033935547, lat: 7.20250082016003 },
{ lng: -73.1452026367187, lat: 7.211100101471 },
{ lng: -73.1360015869141, lat: 7.21739912033081 },
{ lng: -73.1261978149414, lat: 7.22079992294312 },
{ lng: -73.1199035644531, lat: 7.22370100021362 },
{ lng: -73.1118011474609, lat: 7.2241997718811 },
{ lng: -73.1078033447265, lat: 7.22540187835699 },
{ lng: -73.1054992675781, lat: 7.22540187835699 },
{ lng: -73.1054992675781, lat: 7.22129917144787 },
{ lng: -73.1048965454102, lat: 7.21269989013683 },
{ lng: -73.1048965454102, lat: 7.20340108871466 },
{ lng: -73.1031036376953, lat: 7.19760084152222 },
{ lng: -73.0973968505859, lat: 7.1911988258363 },
{ lng: -73.0915985107421, lat: 7.18540000915522 },
{ lng: -73.0864028930664, lat: 7.18370008468634 },
{ lng: -73.077796936035, lat: 7.18019914627087 }
];
// Construct the polygon.
var BucaramangaPolygon = new google.maps.Polygon({
paths: BucaramangaDelimiters,
strokeColor: '#FF0000',
strokeOpacity: 0.8,
strokeWeight: 3,
fillColor: '#FF0000',
fillOpacity: 0.35
});
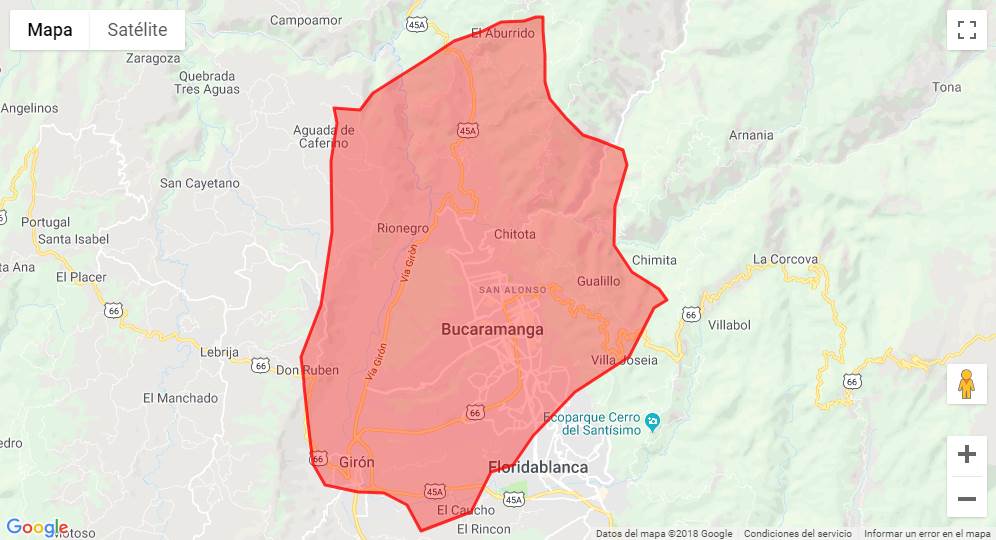
// Draw the polygon on the desired map instance
BucaramangaPolygon.setMap(map);This map would display the following map:
The lazy trick
If you don't want to build manually the array of coordinates, you can use JavaScript to build it automatically from the content of the MultiGeometry Coordinates node of the GADM data using the following function:
/**
 * Creates an array of coordinates from the content of the MultiGeometryCoordinates node of the GADM database.
 */
function buildCoordinatesArrayFromString(MultiGeometryCoordinates){
    var finalData = [];
    var grouped = MultiGeometryCoordinates.split("\n");

    grouped.forEach(function(item, i){
        let a = item.trim().split(',');

        finalData.push({
            lng: parseFloat(a[0]),
            lat: parseFloat(a[1])
        });
    });

    return finalData;
}
Then, just copy the the coordinates from the GADM file as a literal string in the following way (note the linebreaks in the literal string):
let kmlAreaData = `-73.077796936035,7.18019914627087
-73.0765991210938,7.17500114440924
-73.0805969238281,7.16109991073608
-73.081199645996,7.14789915084839
-73.0748977661132,7.13860082626343
-73.0655975341797,7.13280010223394
-73.0626983642578,7.12929916381836
-73.0673980712889,7.1263999938966
-73.0759963989258,7.10970115661621
-73.084098815918,7.10449981689459
-73.0943984985352,7.09769916534424
-73.1088027954102,7.08269977569586
-73.1156997680664,7.07289981842052
-73.1231994628906,7.07060003280645
-73.1300964355469,7.05680179595953
-73.1393966674804,7.05340003967291
-73.1473999023437,7.05050086975098
-73.152099609375,7.05919981002808
-73.1601028442383,7.06330013275158
-73.1688003540039,7.06389999389648
-73.1802978515624,7.06629991531383
-73.1843032836913,7.07320117950451
-73.1860961914062,7.08760023117071
-73.1884002685546,7.1096010208131
-73.1815032958984,7.12750101089489
-73.1780014038085,7.15230083465588
-73.1781005859374,7.17660093307501
-73.1763000488281,7.18930006027233
-73.1770782470703,7.19456291198725
-73.1682968139647,7.19389915466314
-73.1636962890624,7.1995987892152
-73.1591033935547,7.20250082016003
-73.1452026367187,7.211100101471
-73.1360015869141,7.21739912033081
-73.1261978149414,7.22079992294312
-73.1199035644531,7.22370100021362
-73.1118011474609,7.2241997718811
-73.1078033447265,7.22540187835699
-73.1054992675781,7.22540187835699
-73.1054992675781,7.22129917144787
-73.1048965454102,7.21269989013683
-73.1048965454102,7.20340108871466
-73.1031036376953,7.19760084152222
-73.0973968505859,7.1911988258363
-73.0915985107421,7.18540000915522
-73.0864028930664,7.18370008468634
-73.077796936035,7.18019914627087`;

var coordinates = buildCoordinatesArrayFromString(kmlAreaData);

/**
 *  Builds an array with following structure:
    [
        { lng: -73.077796936035,  lat: 7.18019914627087 },
        { lng: -73.0805969238281, lat: 7.16109991073608 },
        ....
    ]
*/
console.log(finalData);
Then you can use the finalData variable to draw the coordinates, for example:
// Initialize some map with center at Bucaramanga
var map = new google.maps.Map(document.getElementById('marker-map'), {
    center: {
        lat: 7.119082288502541,
        lng: -73.120029012106
    },
    zoom: 13,
    mapTypeId: 'roadmap'
});

let kmlAreaData = `-73.077796936035,7.18019914627087
-73.0765991210938,7.17500114440924
-73.0805969238281,7.16109991073608
-73.081199645996,7.14789915084839
-73.0748977661132,7.13860082626343
-73.0655975341797,7.13280010223394
-73.0626983642578,7.12929916381836
-73.0673980712889,7.1263999938966
-73.0759963989258,7.10970115661621
-73.084098815918,7.10449981689459
-73.0943984985352,7.09769916534424
-73.1088027954102,7.08269977569586
-73.1156997680664,7.07289981842052
-73.1231994628906,7.07060003280645
-73.1300964355469,7.05680179595953
-73.1393966674804,7.05340003967291
-73.1473999023437,7.05050086975098
-73.152099609375,7.05919981002808
-73.1601028442383,7.06330013275158
-73.1688003540039,7.06389999389648
-73.1802978515624,7.06629991531383
-73.1843032836913,7.07320117950451
-73.1860961914062,7.08760023117071
-73.1884002685546,7.1096010208131
-73.1815032958984,7.12750101089489
-73.1780014038085,7.15230083465588
-73.1781005859374,7.17660093307501
-73.1763000488281,7.18930006027233
-73.1770782470703,7.19456291198725
-73.1682968139647,7.19389915466314
-73.1636962890624,7.1995987892152
-73.1591033935547,7.20250082016003
-73.1452026367187,7.211100101471
-73.1360015869141,7.21739912033081
-73.1261978149414,7.22079992294312
-73.1199035644531,7.22370100021362
-73.1118011474609,7.2241997718811
-73.1078033447265,7.22540187835699
-73.1054992675781,7.22540187835699
-73.1054992675781,7.22129917144787
-73.1048965454102,7.21269989013683
-73.1048965454102,7.20340108871466
-73.1031036376953,7.19760084152222
-73.0973968505859,7.1911988258363
-73.0915985107421,7.18540000915522
-73.0864028930664,7.18370008468634
-73.077796936035,7.18019914627087`;

var BucaramangaDelimiters = buildCoordinatesArrayFromString(kmlAreaData);

// Construct the polygon.
var BucaramangaPolygon = new google.maps.Polygon({
    paths: BucaramangaDelimiters,
    strokeColor: '#FF0000',
    strokeOpacity: 0.8,
    strokeWeight: 3,
    fillColor: '#FF0000',
    fillOpacity: 0.35
});

// Draw the polygon on the desired map instance
BucaramangaPolygon.setMap(map);
However note that this is a lazy approach, and it looks better if you build the array manually. You can as well use JSON.stringify(finalData) and then copy the created array and paste it in your code, so the function can be an useful helper.
B. Drawing a KML Layer
If instead of drawing through coordinates using JavaScript on the map, you can use the KML format as well drawing its data with the KmlLayer API of Google Maps. The way this API works is the following, you can draw directly a layer over the map using the the following syntax:
var ctaLayer = new google.maps.KmlLayer({
    url: 'http://some-public-domain.com/my-kmlfile.kml',
    map: map
});
For example, in our case the KML structure for our city Bucaramanga can be drawn on the map with the following bucaramanga.kml file:
Important note
The KmlLayer method is a public service of Google that works on their server, this means that the file needs to be exposed on the web and it needs to be accessed without any kind of authentication (their servers need to be able to make a request to the file and get its content without any problem), otherwise the Kml Layer won't be drawn.
The file must be KML compliant as well, this means that the Document root needs to have an schema, a folder and finally the MultiGeometry container with the coordinates. You can see an example below, note that you can extract such information from the GADM files from any of their levels and then build your own file with the data that you need.
<?xml version="1.0" encoding="utf-8" ?>
<kml xmlns="http://www.opengis.net/kml/2.2">
    <Document id="root_doc">
            <Schema name="gadm36_COL_2" id="gadm36_COL_2">
                <SimpleField name="NAME_0" type="string"></SimpleField>
                <SimpleField name="NAME_1" type="string"></SimpleField>
                <SimpleField name="NAME_2" type="string"></SimpleField>
            </Schema>
            <Folder>
                    <name>gadm36_COL_2</name>
                    <Placemark>
                    <Style><LineStyle><color>ff0000ff</color></LineStyle><PolyStyle><fill>0</fill></PolyStyle></Style>
                    <ExtendedData><SchemaData schemaUrl="#gadm36_COL_2">
                                    <SimpleData name="NAME_0">Colombia</SimpleData>
                                    <SimpleData name="NAME_1">Santander</SimpleData>
                                    <SimpleData name="NAME_2">Bucaramanga</SimpleData>
                    </SchemaData></ExtendedData>
                        <MultiGeometry><Polygon><outerBoundaryIs><LinearRing><coordinates>-73.077796936035,7.18019914627087 -73.0765991210938,7.17500114440924 -73.0805969238281,7.16109991073608 -73.081199645996,7.14789915084839 -73.0748977661132,7.13860082626343 -73.0655975341797,7.13280010223394 -73.0626983642578,7.12929916381836 -73.0673980712889,7.1263999938966 -73.0759963989258,7.10970115661621 -73.084098815918,7.10449981689459 -73.0943984985352,7.09769916534424 -73.1088027954102,7.08269977569586 -73.1156997680664,7.07289981842052 -73.1231994628906,7.07060003280645 -73.1300964355469,7.05680179595953 -73.1393966674804,7.05340003967291 -73.1473999023437,7.05050086975098 -73.152099609375,7.05919981002808 -73.1601028442383,7.06330013275158 -73.1688003540039,7.06389999389648 -73.1802978515624,7.06629991531383 -73.1843032836913,7.07320117950451 -73.1860961914062,7.08760023117071 -73.1884002685546,7.1096010208131 -73.1815032958984,7.12750101089489 -73.1780014038085,7.15230083465588 -73.1781005859374,7.17660093307501 -73.1763000488281,7.18930006027233 -73.1770782470703,7.19456291198725 -73.1682968139647,7.19389915466314 -73.1636962890624,7.1995987892152 -73.1591033935547,7.20250082016003 -73.1452026367187,7.211100101471 -73.1360015869141,7.21739912033081 -73.1261978149414,7.22079992294312 -73.1199035644531,7.22370100021362 -73.1118011474609,7.2241997718811 -73.1078033447265,7.22540187835699 -73.1054992675781,7.22540187835699 -73.1054992675781,7.22129917144787 -73.1048965454102,7.21269989013683 -73.1048965454102,7.20340108871466 -73.1031036376953,7.19760084152222 -73.0973968505859,7.1911988258363 -73.0915985107421,7.18540000915522 -73.0864028930664,7.18370008468634 -73.077796936035,7.18019914627087</coordinates></LinearRing></outerBoundaryIs></Polygon></MultiGeometry>
                    </Placemark>
            </Folder>
    </Document>
</kml>
Now, assuming that we have hosted the previous file with the coordinates of Bucaramanga hosted on a public server accesible by Google or anyone at http://mydomain.com/bucaramanga.kml, we could draw the layer on the map with the following code:
// Initialize some map with center at Bucaramanga
var map = new google.maps.Map(document.getElementById('marker-map'), {
    center: {
        lat: 7.119082288502541,
        lng: -73.120029012106
    },
    zoom: 13,
    mapTypeId: 'roadmap'
});

// Draw KML File to highlight the Bucaramanga Area
var ctaLayer = new google.maps.KmlLayer({
    url: 'http://mydomain.com/bucaramanga.kml',
    map: map
});
This would render a map like the following one:
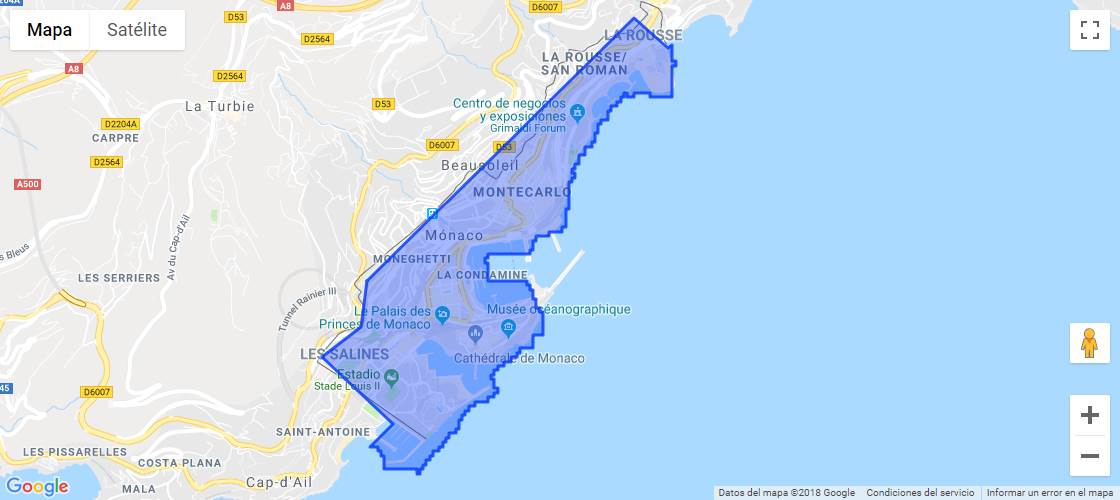
Highlighting countries
Follow the same process, however you may know that countries will have more coordinates (a lot of them, so it will be pretty painful to build the coordinates as objects, however it's the only way), for example with Monaco (a little country with only 158 coordinates to draw):
Note
We are using the helper method buildCoordinatesArrayFromString as we are pretty lazy to make an array of coordinates in JavaScript, so we just provide the string of coordinates and that's it.
// Initialize some map with center at Monaco
var map = new google.maps.Map(document.getElementById('marker-map'), {
    center: {
        lat: 43.73841760000001,
        lng: 7.42461579999997
    },
    zoom: 13,
    mapTypeId: 'roadmap'
});

let kmlAreaData = `7.41338348388666,43.734588623047
7.43630027771002,43.750888824463
7.43923950195318,43.7490272521972
7.43958282470709,43.7492141723633
7.43958187103277,43.7481956481934
7.43985986709589,43.7481956481934
7.43985986709589,43.747917175293
7.43958187103277,43.747917175293
7.43958187103277,43.7459716796876
7.43763780593878,43.7459716796876
7.43763780593878,43.7462501525879
7.43625020980835,43.7462501525879
7.43625020980835,43.7459716796876
7.43569421768188,43.7459716796876
7.43569421768188,43.7462501525879
7.43541622161871,43.7462501525879
7.43541622161871,43.7459716796876
7.43513822555542,43.7459716796876
7.43513822555542,43.7456932067872
7.43486213684088,43.7456932067872
7.43486213684088,43.745418548584
7.43430614471436,43.745418548584
7.43430614471436,43.7451400756836
7.43402814865124,43.7451400756836
7.43402814865124,43.7445831298828
7.43347215652477,43.7445831298828
7.43347215652477,43.7443046569824
7.43319416046143,43.7443046569824
7.43319416046143,43.743751525879
7.43291616439831,43.743751525879
7.43291616439831,43.7431945800782
7.43264007568354,43.7431945800782
7.43263816833496,43.7429161071778
7.43208408355707,43.7429161071778
7.43208408355707,43.7423629760743
7.43152809143078,43.7423629760743
7.43152809143078,43.7418060302735
7.43125009536749,43.7418060302735
7.43125009536749,43.7415275573731
7.43097209930431,43.7415275573731
7.43097209930431,43.7412490844728
7.43125009536749,43.7412490844728
7.43125009536749,43.7409706115724
7.43097209930431,43.7409706115724
7.43097209930431,43.7406959533691
7.43069410324097,43.7406959533691
7.43069410324097,43.7390289306641
7.43041610717785,43.7390289306641
7.43041610717785,43.7379150390625
7.43014001846313,43.7379150390625
7.43014001846313,43.7376403808595
7.42902803421015,43.7376403808595
7.42902803421015,43.7373619079591
7.4279150962829,43.7373619079591
7.4279150962829,43.7370834350587
7.42763996124268,43.7370834350587
7.42763996124268,43.7365264892579
7.4273619651795,43.7365264892579
7.4273619651795,43.7362518310547
7.42676019668579,43.7362518310547
7.42374897003185,43.7362518310547
7.42374897003185,43.7359733581544
7.42347288131708,43.7359733581544
7.42347288131708,43.735694885254
7.42374897003185,43.735694885254
7.42374897003185,43.7345848083496
7.42558193206787,43.7345848083496
7.42708396911621,43.7345848083496
7.42708396911621,43.7343063354492
7.4273619651795,43.7343063354492
7.4273619651795,43.7340278625488
7.42763996124268,43.7340278625488
7.42763996124268,43.7334709167481
7.4279150962829,43.7334709167481
7.4279150962829,43.7329177856445
7.42819309234625,43.7329177856445
7.42819309234625,43.7326393127441
7.42847204208368,43.7326393127441
7.42847204208368,43.7312507629396
7.42763996124268,43.7312507629396
7.42763996124268,43.7304153442384
7.42652702331543,43.7304153442384
7.42652702331543,43.7301406860352
7.42624902725225,43.7301406860352
7.42624902725225,43.7298622131348
7.42569589614868,43.7298622131348
7.42569589614868,43.7295837402344
7.4251389503479,43.7295837402344
7.4251389503479,43.729305267334
7.42458295822144,43.729305267334
7.42458295822144,43.7290267944337
7.42430496215832,43.7290267944337
7.42430496215832,43.7287483215333
7.42402696609497,43.7287483215333
7.42402696609497,43.7284736633301
7.42430496215832,43.7284736633301
7.42430496215832,43.7279167175293
7.42458295822144,43.7279167175293
7.42458295822144,43.7276382446289
7.42430496215832,43.7276382446289
7.42430496215832,43.7273597717286
7.42374897003185,43.7273597717286
7.42374897003185,43.7270851135255
7.4226388931275,43.7270851135255
7.4226388931275,43.7268066406249
7.42208290100103,43.7268066406249
7.42208290100103,43.7265281677246
7.42180490493786,43.7265281677246
7.42180490493786,43.7262496948242
7.42152690887451,43.7262496948242
7.42152690887451,43.7259712219238
7.42124891281139,43.7259712219238
7.42124891281139,43.7254180908204
7.42097282409668,43.7254180908204
7.42097282409668,43.72513961792
7.42041683197016,43.72513961792
7.42041683197016,43.7248611450196
7.42013883590704,43.7248611450196
7.42013883590704,43.7245826721193
7.41986083984369,43.7245826721193
7.41986083984369,43.7243041992189
7.41958284378057,43.7243041992189
7.41958284378057,43.7240295410157
7.41902685165411,43.7240295410157
7.41902685165411,43.7237510681153
7.41874885559093,43.7237510681153
7.41874885559093,43.7234725952149
7.41847276687622,43.7234725952149
7.41847276687622,43.7231941223145
7.41819477081305,43.7231941223145
7.41819477081305,43.7229156494141
7.41791677474976,43.7229156494141
7.41791677474976,43.7226371765137
7.41763877868658,43.7226371765137
7.41763877868658,43.7229156494141
7.41486120224005,43.7229156494141
7.41486120224005,43.7237510681153
7.4145817756654,43.7237510681153
7.4145817756654,43.7240295410157
7.41430711746216,43.7240295410157
7.41430711746216,43.7243041992189
7.41365289688116,43.7243041992189
7.41562128067011,43.7257347106935
7.40952730178844,43.729866027832
7.4128274917602,43.7317237854004
7.41338348388666,43.734588623047`;

var MonacoDelimiters = buildCoordinatesArrayFromString(kmlAreaData);

// Construct the polygon.
var MonacoPolygon = new google.maps.Polygon({
    paths: BucaramangaDelimiters,
    strokeColor: '#0037FF',
    strokeOpacity: 0.8,
    strokeWeight: 3,
    fillColor: '#0037FF',
    fillOpacity: 0.35
});

// Draw the polygon on the desired map instance
MonacoPolygon.setMap(map);
This will show a map like:
Happy coding !

