

Consider the following context as that's the one I found myself a couple of months ago. I was working on a large Symfony project that runs on PHP 7, as we all know, the libraries to create charts in PHP are really awful. So the option was to simply create the charts using an alternative solution in JavaScript as the charts should only appear on the browser when the user uses the application. Unfortunately, a couple of months after, they required the creation of PDF reports that needed to have the same charts that were shown on the browser (yeah great, I need to embed them in PDFs as well). For the knowledge I had till that point, the situation was very problematic.
After some research, I discovered that fortunately, I was using Highcharts to create the charts in the browser, so the solution existed already to implement it on the server-side, so I wouldn't need either to rewrite the charts on the server-side as the code of the charts in the frontend should be similar.
In this article, I will explain to you how to easily render highcharts on your server using Node.js and the highcharts-export-server module.
Requirements
We assume that you have Node.js already installed on your server.
Install Highcharts Export Server
The first way to use the highcharts-export-server is to use it as a module. This means, writing your own script, creating the image version of the charts in a custom way. In this case, we will simply create a script that will use custom code to generate the charts. The second way is to run the module as an HTTP service (as a server), so third party applications like the one you are working it can simply do a request to this server to obtain the image as a response.
As the first step, install the module using NPM with the following command:
npm install highcharts-export-serverThe installation will take a while as this will install the Highcharts library and PhantomJS. When installing highcharts you will be prompted for information about licenses and other modules, in our case, we will use the free version so the answer to most of the prompts it will make, will be answered with a no.
For more information about the highcharts-export-server module, please visit the official repository at Github here.
A. Using Highcharts Export Server as a module
There are multiple ways to export your chart using the highcharts export server. I will describe the most useful ones in this article:
Exporting as a PNG image
In this example, we will create the index.js file that will be executed with Node.js. This file contains the basic implementation of the highcharts export module, where it will be imported along with the filesystem module. Then, initialize the exporter (PhantomJS) and define the options of the chart. The object chartOptions contains the information that you use as usual to plot the chart in the frontend, the labels, data, and so on. Then use the export method of the chartExporter to run to draw the chart on the headless browser (PhantomJS), when it's rendered, the browser will trigger the callback that will allow you to obtain the base64 information of the image to store it into a file:
// /index.js

// 1. Import filesystem and Highcharts Export Server module
const fs = require("fs");
const chartExporter = require("highcharts-export-server");

// Initialize the exporter
chartExporter.initPool();
// Chart details object specifies chart type and data to plot

// Usually the same object that you use to configure your charts
// in the frontend. This will be used to specify the chart type
// and data to plot. I will use a bar chart, the same data
// specified in one of the official demonstrations in the HC website
let chartOptions = {
    chart: {
        type: 'bar'
    },
    title: {
        text: 'Historic World Population by Region'
    },
    subtitle: {
        text: 'Source: Our Code World'
    },
    xAxis: {
        categories: ['Africa', 'America', 'Asia', 'Europe', 'Oceania'],
        title: {
            text: null
        }
    },
    yAxis: {
        min: 0,
        title: {
            text: 'Population (millions)',
            align: 'high'
        },
        labels: {
            overflow: 'justify'
        }
    },
    tooltip: {
        valueSuffix: ' millions'
    },
    plotOptions: {
        bar: {
            dataLabels: {
                enabled: true
            }
        }
    },
    legend: {
        layout: 'vertical',
        align: 'right',
        verticalAlign: 'top',
        x: -40,
        y: 80,
        floating: true,
        borderWidth: 1,
        backgroundColor: '#FFFFFF',
        shadow: true
    },
    credits: {
        enabled: false
    },
    series: [{
        name: 'Year 1800',
        data: [107, 31, 635, 203, 2]
    }, {
        name: 'Year 1900',
        data: [133, 156, 947, 408, 6]
    }, {
        name: 'Year 2000',
        data: [814, 841, 3714, 727, 31]
    }, {
        name: 'Year 2016',
        data: [1216, 1001, 4436, 738, 40]
    }]
};

// Export chart using these options
chartExporter.export({
    type: "png",
    options: chartOptions,
    // By default the width of the chart images is of 600
    // In this case, we want a big image
    width: 1200
}, (err, res) => {
    // Get the image data (base64)
    let imageb64 = res.data;

    // Filename of the output. In this case, we will write the image
    // to the same directory of the initialization script.
    let outputFile = "./output-chart.png";

    // Save the image data to a file
    fs.writeFileSync(outputFile, imageb64, "base64", function (err) {
        if (err) console.log(err);
    });

    console.log("The chart has been succesfully generated!");

    chartExporter.killPool();
});
If you run the script with Node.js using:
node index.jsThe script will be executed, generating a success output, and the image output-chart.png, that in this case with the information of this example will look like this:
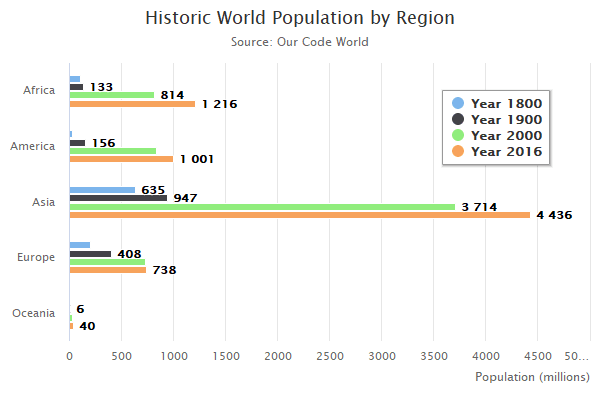
The image could be now embedded wherever you want, in the browser, in a PDF, etc.
Using as a module (exporting as an SVG file)
If you want to export the chart in SVG format, you may do it as well using the module. You need to change the type property using SVG as value and provide the outfile parameter as well:
// /index.js

// 1. Import filesystem and Highcharts Export Server module
const fs = require("fs");
const chartExporter = require("highcharts-export-server");

// Initialize the exporter
chartExporter.initPool();
// Chart details object specifies chart type and data to plot

// Usually the same object that you use to configure your charts
// in the frontend. This will be used to specify the chart type
// and data to plot. I will use a bar chart, the same data
// specified in one of the official demonstrations in the HC website
let chartOptions = {
    // .. Chart Type, Data etc.
};

// Export chart using these options
// Export the chart as an SVG file
chartExporter.export({
    type: "svg",
    outfile: "./output-file.svg",
    options: chartOptions
}, (err, res) => {
    console.log(`The chart has been succesfully generated as SVG at ${res.filename}!`);

    chartExporter.killPool();
});
B. Using Highcharts Export as a service
Now, the first solution, using it as a module is great for small applications, where the feature wouldn't be used way too much theoretically. However, if you are trying to create a service where multiple applications can interact with the creation of the chart image, the best way to do it is to run the module as a server. Therefore, you need to install highcharts-export-server globally:
npm install highcharts-export-server -gThe installation will prompt the same things as when installing as a module, licenses, installation of PhantomJS, etc. When the installation finishes, you should be able to run the command from the terminal enabling it as a server with the enableServer parameter:
highcharts-export-server --enableServer 1 --host localhost --port 7801This command will basically start the server with the given configuration:
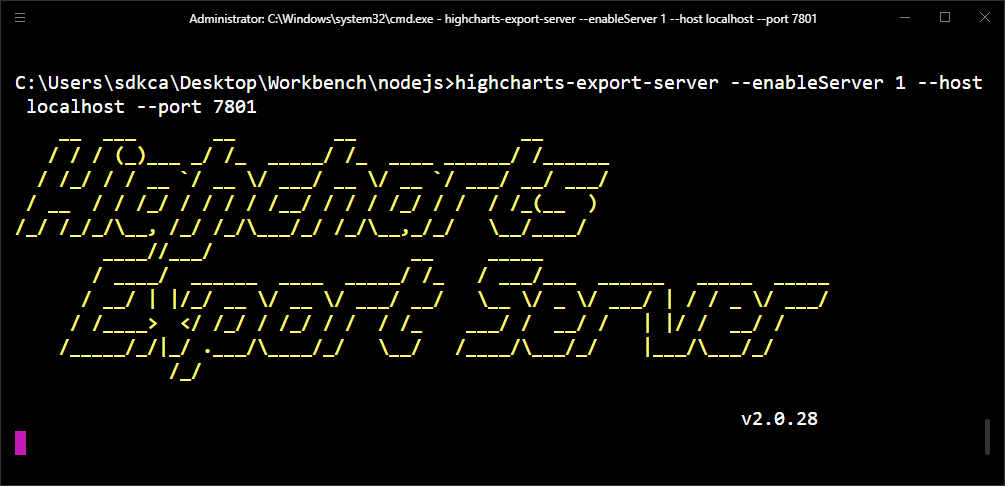
in this case, the address would be http://localhost:7801, as I'm working locally. If you want to run this on a live server you will need as well configure the reverse proxy, Nginx if you want to use it with a specific domain.
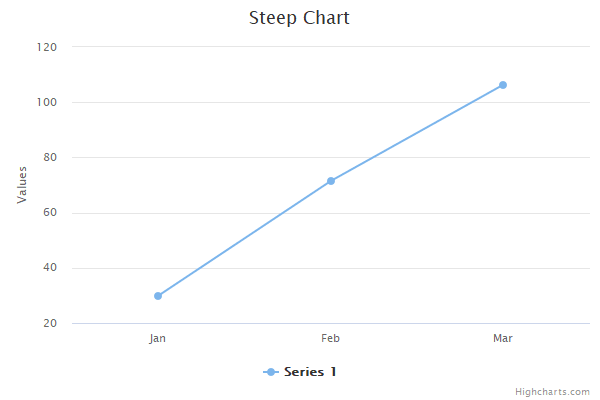
Now, with this, you will be able to render the charts from a web service. Execute a simple application/json request with the chart data to the defined address and the response will be an image of the chart. The JSON that we are sending in the request will be the following one:
{
    "infile": {
        "title": {
            "text": "Steep Chart"
        },
        "xAxis": {
            "categories": [
                "Jan",
                "Feb",
                "Mar"
            ]
        },
        "series": [
            {
                "data": [
                    29.9,
                    71.5,
                    106.4
                ]
            }
        ]
    },
    "width": 1200
}
You can test it with curl, for example, the following command will request the chart with the previous information and will store it in the output-file.png file:
curl -H "Content-Type: application/json" -X POST -d "{ \"infile\": { \"title\": { \"text\": \"Steep Chart\" }, \"xAxis\": { \"categories\": [ \"Jan\", \"Feb\", \"Mar\" ] }, \"series\": [ { \"data\": [ 29.9, 71.5, 106.4 ] } ] }, \"width\": 1200 }" localhost:7801 -o output-file.pngThe response, in this case, will be:
Happy coding ❤️!

