
Puppeteer can be used nowadays for multiple things such as web scraping, automation and testing purposes. A lot of projects decide to use Puppeteer for any of the mentioned tasks in their projects, however not everyone knows how to debug an instance of Chrome being manipulated by Puppeteer in headless mode. Debugging is easy using the Chrome Dev Tools as long as the headless mode is disabled, however when is enabled (in an environment where it needs to be disabled obligatorily like a server) it's not that easy to debug without the proper tools.
In this article, I will explain you shortly how to connect to debug a Puppeteer script using Google Chrome's Remote Debugger.
The Puppeteer script
To get started, you will need a functional puppeteer script that remains open so we can debug what's going on. This example script is going to simply start Puppeteer and will keep it open until the user stops the execution. It will create a screenshot from a website, in this case my profile at GitHub and that's it, nothing fancy. What matters in this script is the configuration, but I'll explain it in the next section:
// script.js
// require fs and puppeteer
const fs = require("fs");
const puppeteer = require("puppeteer");

async function captureScreenshot() {
    // if screenshots directory is not exist then create one
    if (!fs.existsSync("screenshots")) {
        fs.mkdirSync("screenshots");
    }

    let browser = null;

    try {
        const options = {
            headless: true,
            devtools: true,
            args: [
                '--remote-debugging-port=9222',
                '--remote-debugging-address=0.0.0.0',
                '--no-sandbox'
            ]
        };

        // launch headless Chromium browser
        browser = await puppeteer.launch(options);

        // create new page object
        const page = await browser.newPage();

        // set viewport width and height
        await page.setViewport({ width: 1440, height: 1080 });

        await page.goto("https://github.com/sdkcarlos");

        // capture screenshot and store it into screenshots directory.
        await page.screenshot({ path: `screenshots/github-profile.jpeg` });
    } catch (err) {
        console.log(`❌ Error: ${err.message}`);
    } finally {
        console.log(`\n🎉 The screenshot has been succesfully generated.`);
    }
}

captureScreenshot();
You can use this script to test in case that you don't have already an environment with Puppeteer.
A. Debugging locally
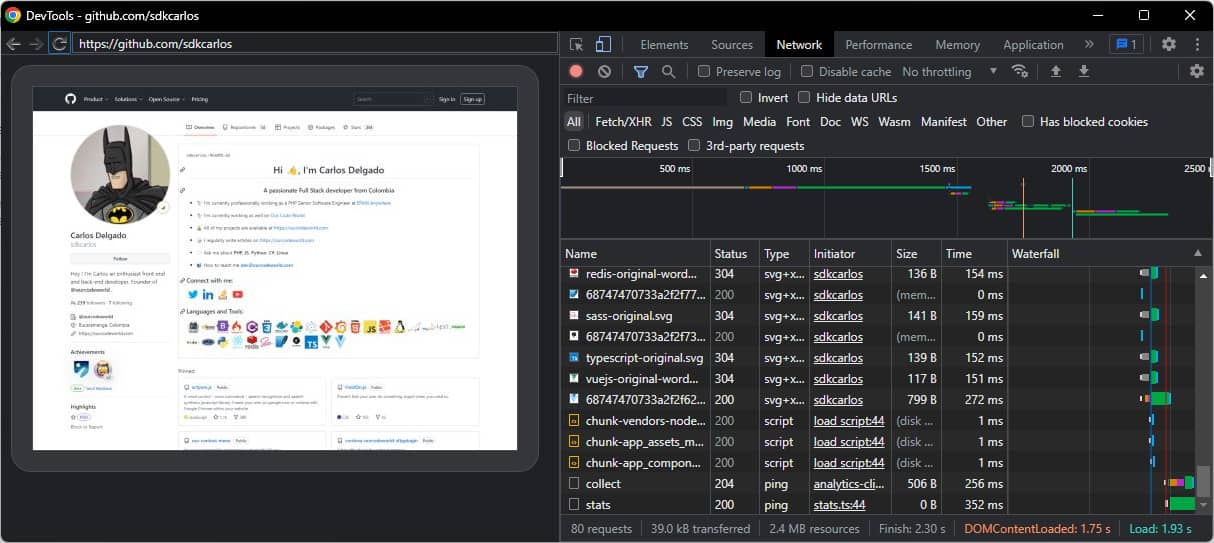
If you're working locally, running a Node.js script in your Windows, Mac or Linux environment, this script will work without any issue nor special configuration. Navigate to chrome://inspect in your Google Chrome browser and go to the Devices tab. Once you start the puppeteer script (node script.js) and wait for about 15 seconds, the remote target should appear as an item in the list. In this case, my script opens my Github profile so you can see the URL in the list, click on the inspect button:

And you should be able to inspect the elements as if it were directly loaded in Google Chrome:
And all while being instantiated directly from a Puppeteer script! You can kill the script to stop the debugging whenever you need to. This should be helpful enough to debug when you're working in your local environment.
B. Debugging puppeteer in a docker container (locally and remotely)
While launching your Puppeteer instance, be sure to specify the remote debugging port that will be used to connect to your device. The port is usually 9222 and use the non-routable address 0.0.0.0 as the remote debugging address:
const options = {
    headless: true,
    devtools: true,
    args: [
        '--remote-debugging-port=9222',
        '--remote-debugging-address=0.0.0.0',
        '--no-sandbox'
    ]
};
Depending on your setup, you may have configured your containers maybe to have Puppeteer initialized when the container starts or maybe you start it dinamically whenever you need to. In my case, the Puppeteer script will run only when I run it manually with:
node script.jsSo the debugging will be available only as long as the script is running, that's why the Puppeteer script given as example never finishes, it will remain active until you stop the execution, in this way it will be easier for the chrome remote debugger to recognize the instance of Chrome for you to debug it. Having said that, I'll explain quickly my Docker environment for this example.
B.1. Environment example
For this tutorial, I created the following docker environment that uses alpine, Chromium 100 and Puppeteer v13.5. The Dockerfile looks like this:
FROM alpine

# Installs latest Chromium (100) package.
RUN apk add --no-cache \
    chromium \
    nss \
    freetype \
    harfbuzz \
    ca-certificates \
    ttf-freefont \
    nodejs \
    yarn

RUN apk add nano

# Tell Puppeteer to skip installing Chrome. We'll be using the installed package.
ENV PUPPETEER_EXECUTABLE_PATH=/usr/bin/chromium-browser

# Puppeteer v13.5.0 works with Chromium 100.
RUN yarn add [email protected]

# Add user so we don't need --no-sandbox.
RUN addgroup -S pptruser && adduser -S -G pptruser pptruser \
    && mkdir -p /home/pptruser/Downloads /app \
    && chown -R pptruser:pptruser /home/pptruser \
    && chown -R pptruser:pptruser /app

# Run everything after as non-privileged user.
USER pptruser

ENTRYPOINT ["tail", "-f", "/dev/null"]

EXPOSE 9222
And the following docker-compose.yml file to start a container namely puppeteer that shares a simple volume to work from the host (workspace directory where I will store the puppeteer script):
version: "3.9"
services:
  puppeteer:
    build: .
    cap_add:
      - SYS_ADMIN
    ports:
      - '9222:9222'
    volumes:
      - ./workspace:/home/pptruser/workspace
This container can be started using:
docker-compose up -d --buildOnce the container starts, create the script.js file with the Puppeteer script in the workspace directory of the host and launch the script with:
node script.jsThis will launch a functional example of Puppeteer and will keep it alive.
B.2. Connecting Chrome Remote Debugger to instance
Now that we have a running instance of Puppeteer, we need to learn how to debug it remotely from our desktop. In this example, Puppeteer is running as a container in a VPS that runs Ubuntu 20.04 and has a public IP address namely 45.94.xxx.xx. The chrome remote debugger allows you to debug a Chrome instance remotely as long as it's accessible through the specific port that we mention during the configuration of the script. If you do this from a Docker container in your local environment, the address will be localhost:9222 (if you used the same configuration as I did in the example), however if you're debugging a container like in this example, that is hosted on a VPS publicly, you need to specify the IP of the server and the port (keep in mind that the port needs to be open, otherwise Google Chrome won't be able to reach it), for example in my case the address would be 45.94.xxx.xx:9222.
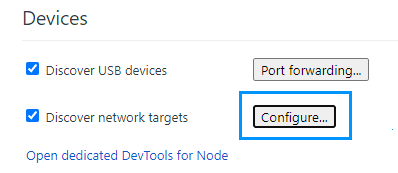
This address can be configured in Google Chrome like this, click on the Configure button under Port forwarding ...:
In the Target discovery settings dialog, add a new entry with the IP and port of the server
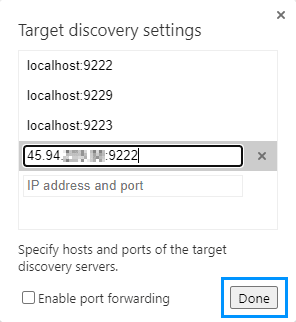
Once you click on done, be sure to start the puppeteer script in your remote server/container:
node script.jsThen open your local Google Chrome and navigate to chrome://inspect. After waiting for about 15 seconds, if your server port is open, Chrome will be able to connect and you will see the item in the devices list:
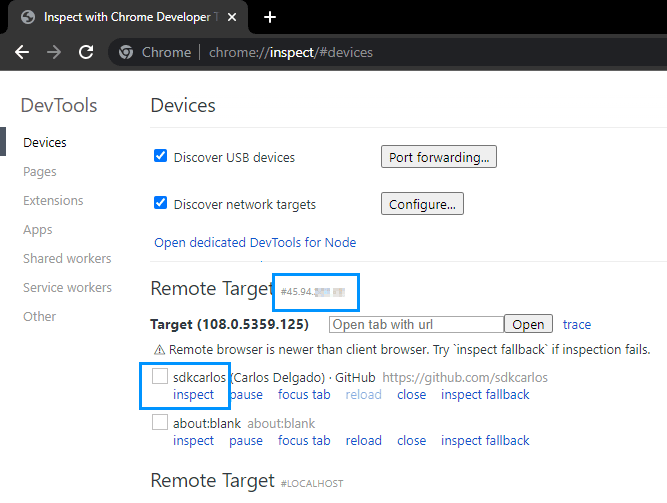
If there are no remote connections and you're sure that the Puppeteer script is running, be sure to:
- Check that the remote debugging port you used in the script is open both in the container and the server.
- Double check that your puppeteer is up and running (check that the script doesn't die after starting it, do not close the browser).
Happy coding ❤️!

