
Choosing a language for data analysis feels simple until the first messy CSV lands on your desk. One file has weird headers, another has missing values, and suddenly your "quick summary" turns into a mini project.
That is why the differences between Python and JavaScript matter in real life. Your choice affects how fast you can clean data, how easy it is to visualize, and how painful the workflow feels at 1 a.m. If you are building this for a class or a work project, you might even look up online assignment help at some point. Either way, the goal stays the same: get reliable insights without fighting your tools.
Key Factors That Crown the Winner
Before you compare libraries or hype, decide what "good" looks like for your use case. Data analysis has a lot of lanes, so your criteria should match the lane you are in.
Here are the decision factors that usually matter most:
- Setup time: how fast you can go from zero to running code.
- Wrangling comfort: filtering, grouping, joining, and missing values.
- Visualization path: quick plots, interactive charts, shareable outputs.
- Stats and modeling: from basic metrics to regression and ML.
- Performance ceiling: what happens when data gets big.
- Collaboration: reviews, reproducibility, and clean project structure.
- Deployment: turning results into a report, notebook, dashboard, or app.
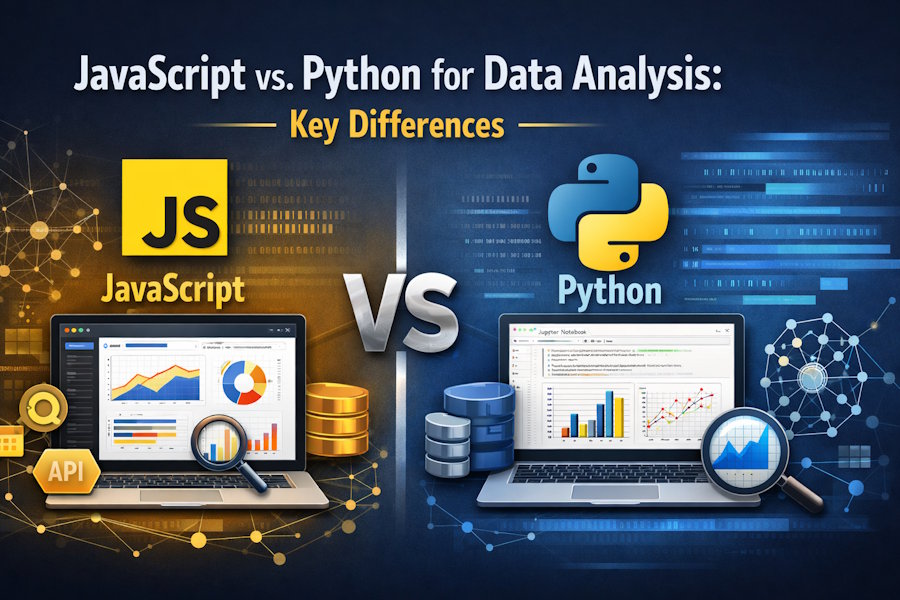
JavaScript for Data Analysis: Best When Your Data Lives in the Web World
JavaScript shines when analysis sits close to a product. If your data comes from web events, APIs, or dashboards your team already ships, staying in JavaScript can reduce friction.
Node.js makes it possible to run scripts, ingest files, hit APIs, and output results. In the browser, you can explore data and visualize it directly where people will use it. That is a huge advantage for interactive storytelling, especially when the final deliverable is a dashboard.
The trade-off is that "analysis-first" workflows can feel less direct. You can absolutely do serious work, but you may spend more time choosing libraries and shaping your setup.
Source: https://unsplash.com/photos/a-computer-screen-with-a-program-running-on-it-JpF58ANavoc
Python: Best When You Need a Massive Library Ecosystem
Python tends to feel natural for analysis because the ecosystem has been shaped by that exact job. You can load a dataset, explore it, clean it, and visualize it with a workflow that many courses and tutorials already follow.
A big reason is the shared conventions. DataFrames, notebook workflows, and common patterns make it easier to jump into existing examples. When you need heavier stats work or a modeling step, Python usually has a shorter path from idea to result.
This is also where data manipulation tends to feel smoother. Tasks like reshaping tables, joining datasets, and handling missing values usually take fewer lines and less mental overhead.
Source: http://unsplash.com/photos/macbook-pro-showing-programming-language-xrVDYZRGdw4
Python vs JavaScript: Head-to-Head Differences That Actually Matter
Both languages can analyze data. The gaps show up in how each one handles common pain points.
- The default workflow. Python commonly starts in notebooks or simple scripts, which fits exploratory work. JavaScript often starts in apps or Node scripts, which fits product-adjacent analysis.
- Working with tables. Python leans on DataFrame-style work, which feels like a spreadsheet with superpowers. JavaScript often uses arrays of objects, which can get wordy during complex grouping and joining.
- Visualization style. JavaScript is great at interactive visuals, especially in the browser. Python is great at fast plots for exploration, plus clean charts for reports.
- Stats and modeling readiness. Python usually wins for statistics, scientific computing, and machine learning workflows. JavaScript can do modeling too, but you may work harder to match the same breadth.
- Performance and scale choices. Python can scale through optimized libraries and parallel workflows. JavaScript can scale through Node streams and web-native data flows, but large numeric workloads often need careful planning.
- Deployment path. If your output is a web dashboard, JavaScript can feel like the shortest road. If your output is a notebook report or a repeatable analysis script, Python often feels straightforward.
- Learning curve for students. Python tends to be easier for beginners doing analysis because the teaching ecosystem is huge. JavaScript feels easier when you already know front-end and want results inside the same stack.
Key Differences at a Glance
If you want a quick overview of data analysis tools before diving into the details, this table can help you decide which one suits your project.
|
Category |
Python |
JavaScript |
|
Best fit |
Analysis-heavy projects, notebooks, ML |
Web dashboards, product analytics, interactive charts |
|
Typical workflow |
Notebooks, scripts, pipelines |
Node scripts, browser apps, dashboards |
|
Wrangling comfort |
Strong, consistent conventions |
Flexible, sometimes more manual |
|
Visualization |
Fast exploration, solid reporting |
Very strong interactivity in web contexts |
|
Stats + ML |
Deep ecosystem |
Possible, but narrower and less standardized |
|
Sharing results |
Notebooks, reports, reproducible projects |
Live dashboards, embedded visuals, web apps |
|
Team context |
Common in data teams |
Common in web teams |
Your Quick Selection Guide & Checklist
If your priority is reliable analysis with a lot of existing learning resources, Python is a safe bet. If your priority is shipping insights inside a web product, JavaScript can make your life easier.
Mira Ellison, who supports students at AssignmentHelp, providing assignment help, often recommends choosing the language that matches your deliverable first and your comfort level second.
A simple checklist helps you decide fast:
- What is the output: notebook report, PDF write-up, dashboard, or app?
- Where does the data come from: files, APIs, database, web events?
- How large is it right now, and how large could it get?
- Do you need statistics or modeling, or mostly summaries and charts?
- Who will review your work: classmates, a professor, a product team?
- Do you need repeatable data processing or a one-time exploration?
- What tools does your team already use and support?
Final Take: Choosing the Right Tool
In practice, both options can work, and many teams use both together. Python often feels like the smoothest route for analysis-heavy work, and JavaScript often feels natural for web-first reporting and interactive visuals.
Treat them as programming languages for data analysis with different home courts. Pick the one that matches where your results will live, then build from there.

