
Your agency sends the Q3 performance report as a polished PDF. Two days later, leadership asks you to present the highlights on Thursday, and they want a few numbers reframed. The data is right there in front of you, locked inside a file you can't touch.
The usual answer is to rebuild the deck from scratch. The faster way is to convert PDF to PowerPoint and start from an editable version of what already exists. In this guide, we use a practical sample, (an 18-page Q3 marketing report) to walk you through the process. We've put together a step-by-step guide to show you exactly how to do it and what to expect, hoping to save you hours of manual work.
Why Rebuilding Marketing Decks Manually Takes So Much Time
Rebuilding a report as slides is not one task. It's a dozen small ones stacked on top of each other.
- Charts are the worst offender. A screenshot of a chart looks blurry on a projector, so you rebuild it in PowerPoint. That means retyping every data point from the PDF into a chart editor, then matching colors, axis labels, and legend placement to the original.
- Tables need the same treatment. A channel performance table with 12 rows and 5 columns means 60 cells retyped by hand. That's where errors happens. Transposing two digits in a conversion rate or dropping a decimal place in ad spend can change what leadership takes away from the slide.
- Brand consistency eats the rest of the time. Section dividers, heading fonts, accent colors, logo placement. Getting one slide right is quick. Getting 18 slides to match each other and the original report takes another pass entirely, and small inconsistencies (a heading 2 points off, an accent color slightly wrong) tend to show up only after you've presented.
For a mid-length report, this is easily half a day. Sometimes more when the source data isn't in a spreadsheet you can reference.
Pre-Flight Checklist: Preparing Your PDF for a Smoother Conversion
Two minutes of checking before you upload saves a lot of cleanup after.
Check whether the text is selectable. Open the PDF and try to highlight a paragraph. If your cursor selects text, the file carries real character data and will convert into editable text. If nothing highlights, you're looking at an image-based file.
Confirm the file isn't scanned. Reports that were printed and scanned back in have no text layer at all. Converting one produces slides containing flat images. If that's what you have, run OCR first or track down the original digital version.
Remove password protection. Most online converters can't process encrypted or permission-locked PDFs. Open the file, save an unprotected copy, and upload that instead.
Check for sensitive content. Marketing reports often carry unreleased figures, client names, or partner data. Before uploading anything to a third-party tool, review the tool's privacy policy and confirm it deletes files after processing. For anything under NDA, converting offline is safer.
Look for a better source file. If someone on the team still has the original InDesign, Canva, or PowerPoint file the PDF was exported from, use it. Nothing converts better than the source.
How to Convert PDF to PowerPoint Online in 3 Steps
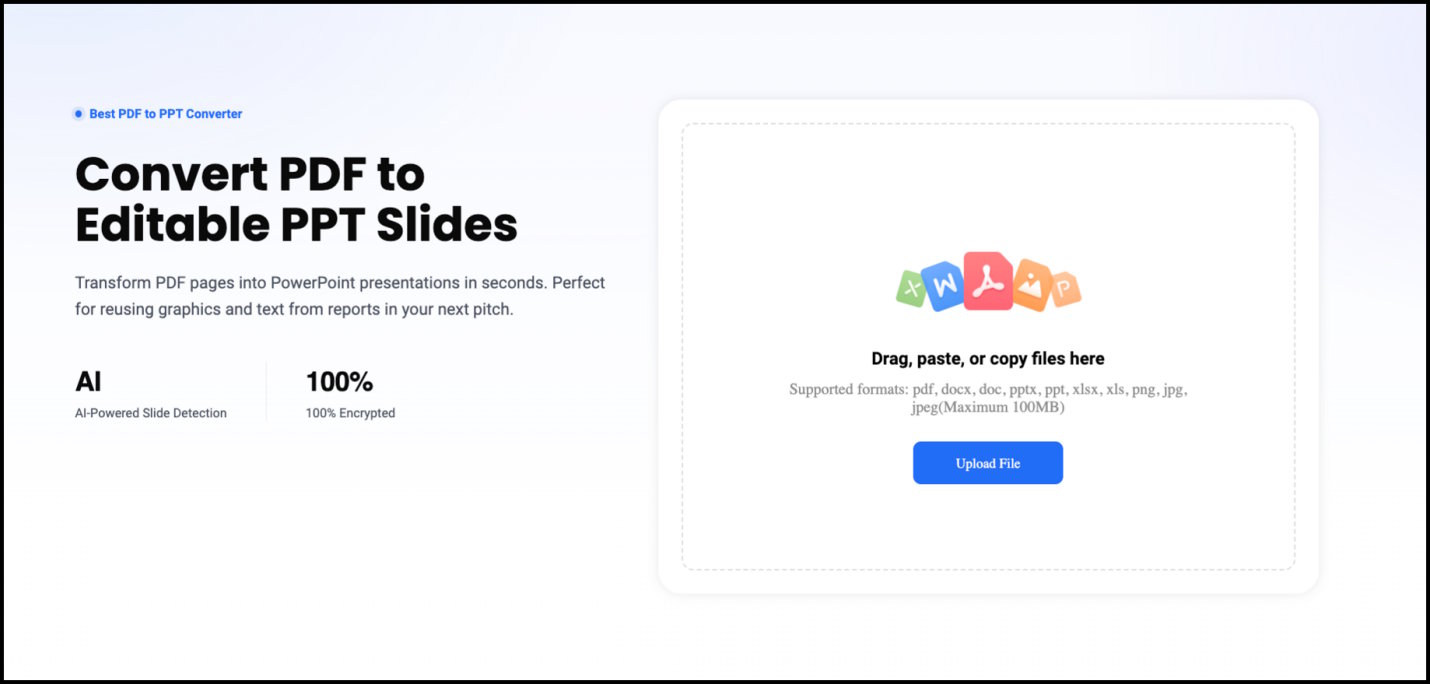
We used the TeraBox PDF to PPT Converter for the test. It runs in the browser, so nothing installs.
Step 1: Upload the PDF
Open the converter page, then drag your file into the upload area or browse for it. Our 8 MB report uploaded in about 20 seconds on a standard connection. Files can also be pulled directly from TeraBox cloud storage if you're signed in.
Step 2: Start the Conversion and Watch the Status
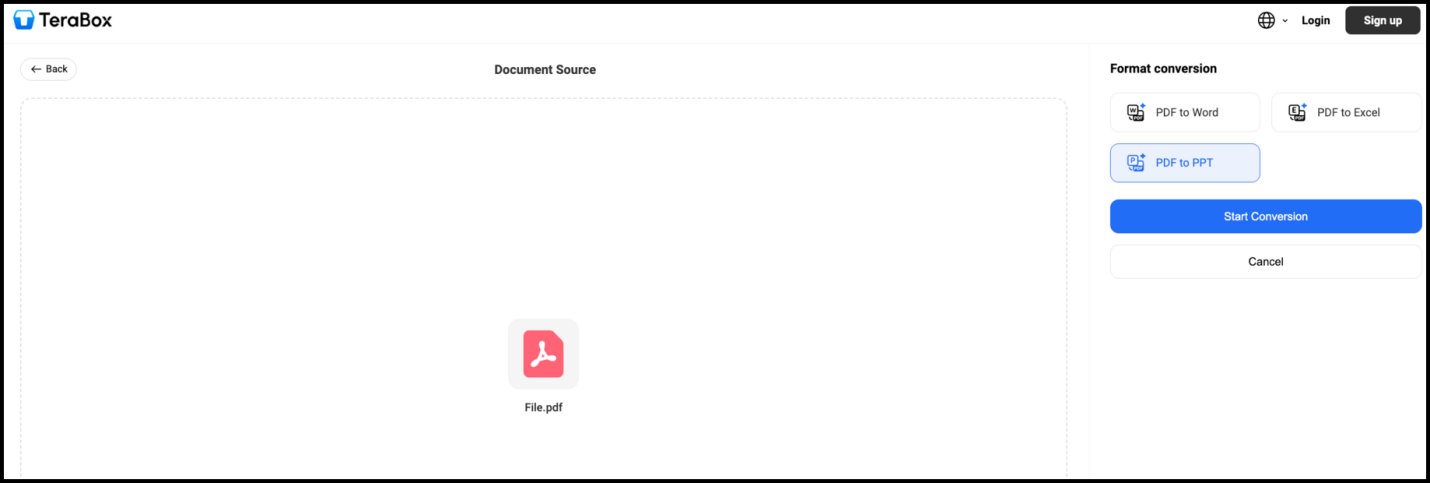
Tap or click Convert. A status indicator shows progress while the tool analyzes the document and maps content into slides. The 18-page report took a little over two minutes. Shorter, text-only PDFs finish considerably faster.
Step 3: Download and Open the PPTX
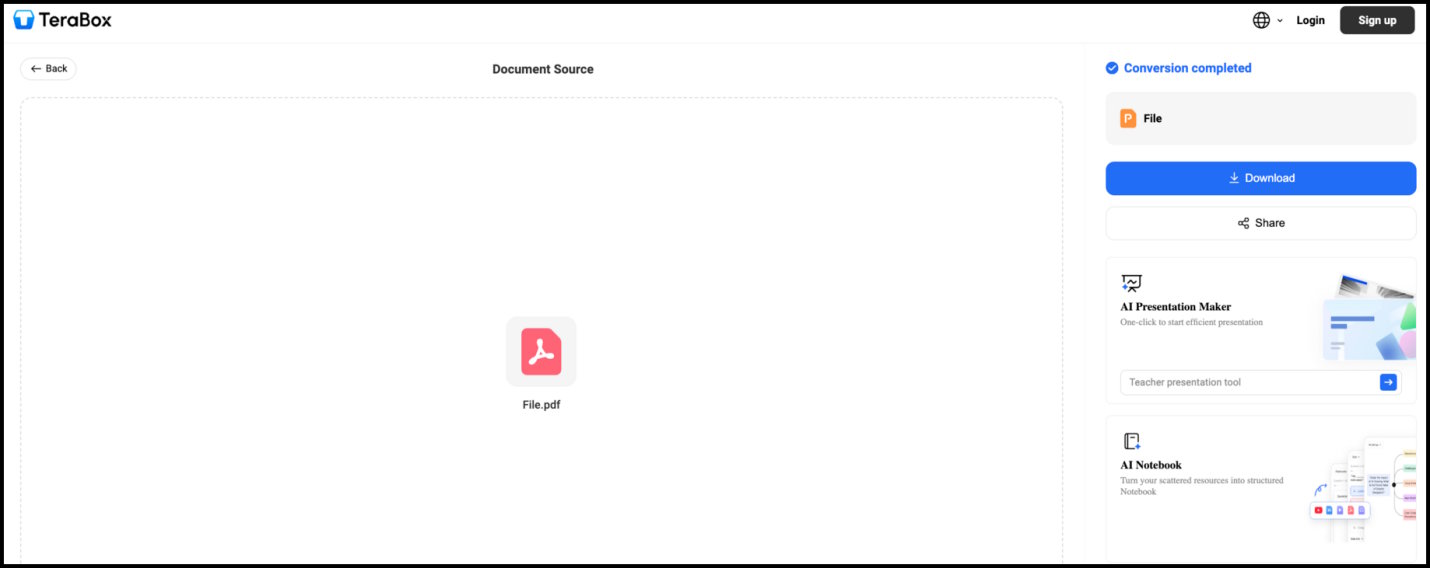
When it finishes, download the file or save it to cloud storage. We opened ours in PowerPoint on desktop.
What Came Out Editable
Text was fully editable, not flattened into images. Headings, body copy, and bullet lists all selected and edited normally, which is the single biggest time saver. Product photography carried over at usable resolution and stayed in position.
The channel performance table converted into an actual PowerPoint table, so we could edit cell values directly instead of retyping the whole thing.
What Needed Adjustment
Charts were flattened as images: The charts copied over clearly and sat in the right positions, but the raw data wasn't editable. If you need to change a figure, you'll need to update that specific chart manually.
Minor layout and font drift: Since custom brand fonts substituted to standard system fonts, a few headings wrapped onto a second line, and text boxes overlapped slightly on two-column pages.
Extra slides carried over: The output mirrored the 18-page count exactly, so report-only pages like appendices still need to be deleted before presenting.
The conversion isn't 100% perfect out of the box, but tidying up a few fonts and text boxes is still far faster than rebuilding the whole presentation from a blank slide.
Post-Conversion Polish: 4 Quick Tweaks for a Presentation-Ready Deck
A converted report is a starting point, not a finished deck. Reports are built to be read. Presentations are built to be watched. Four adjustments close most of that gap.
1. Cut the Slides That Only Belong in a Report
Methodology notes, appendices, data source citations, and disclaimer pages serve a written report. They stall a live presentation. Our 18 slides came down to 11 after removing pages nobody would present.
2. Shorten Dense Paragraphs Into Talking Points
Report copy is written in full paragraphs. On a slide, that's a wall of text your audience reads instead of listening to you. Pull each paragraph down to two or three short lines and move the detail into speaker notes.
3. Make the Key Results Impossible to Miss
Reports bury the headline number inside a chart. Presentations should lead with it. If paid social drove a 34% lift, put that number on the slide at a size people can read from the back of the room, with the chart supporting it rather than hiding it.
4. Fix the Visual Flow
Check that heading sizes, accent colors, and spacing stay consistent across the deck, especially on the slides where font substitution shifted things. If you'd rather not do that manually, TeraBox includes a Beautify Slides feature that applies consistent layout, color, and typography across an existing deck. It accepts PPTX and PPT files up to 20 MB and 100 slides, and you can add instructions like a preferred color scheme before it runs.
FAQs
Will the text be editable after conversion?
Yes, if the source PDF has a real text layer. Converted text behaves like normal PowerPoint text. Scanned or image-based PDFs produce flat images instead.
Can I edit the charts in the converted deck?
Usually not as native charts. Most converters bring charts across as images, which look correct but can't be updated with new data. Plan to rebuild any chart whose figures might change.
How closely does the layout match the original?
Single-column pages usually map well. Multi-column print layouts, custom fonts, and tightly positioned elements are where drift shows up, since a report page and a 16:9 slide have different proportions.
Will the PPTX open in Google Slides or Keynote?
Yes. PPTX is widely supported. Expect minor rendering differences in fonts and spacing between applications, same as with any PowerPoint file.
Is it safe to upload a confidential marketing report?
Check the tool's privacy policy and file retention window before uploading. TeraBox conversion features may require paid access depending on the current plan, so check the current plan details before relying on it for regular work.
Conclusion
Converting a PDF gives you an editable starting point instead of a blank canvas. The text, images, and tables land in place, which removes most of the retyping. What's left is judgment work: deciding what to cut, what to emphasize, and how the story should flow on screen.
Review the finished deck slide by slide before you present or send it. Check the numbers against the original report, especially in any table that converted, and confirm nothing shifted during the font substitution.
If you need to convert PDF to PowerPoint without rebuilding the entire deck,, testing a page or two in TeraBox's converter is a good way to see if it fits your report layout.