
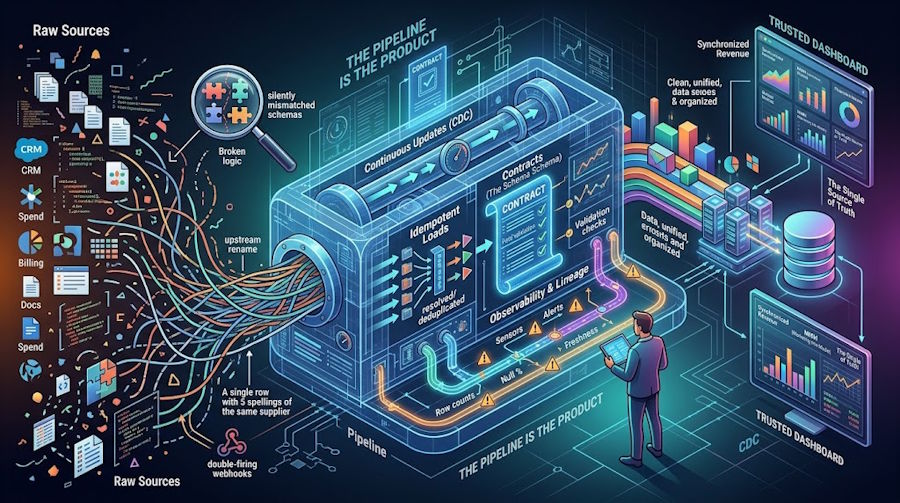
Every SaaS team has a dashboard nobody trusts. It started fine. Someone wired up a few sources, built some charts, and shipped it. Then a column got renamed upstream, a webhook started double-firing, and the revenue number on the executive view drifted four percent away from the one finance keeps in a spreadsheet. Nobody found out until a customer did. The dashboard wasn't the problem. The pipeline underneath it was, and nobody had designed it. It just accumulated.
The Pipeline Is the Product
Developers tend to treat analytics as a feature layered on top of the real application. A chart here, an export button there. That framing breaks down fast once customers start making actual decisions off the numbers you show them. At that point the data pipeline isn't plumbing anymore. It's the thing customers are paying for, whether the pricing page says so or not.
Which changes how it should be built. Plumbing gets patched when it leaks. A product gets designed, versioned, tested, and monitored. Teams that make this shift early spend less time firefighting bad numbers and more time shipping things customers actually asked for. Teams that don't end up with a growing pile of one-off scripts, each written by someone who's since moved on, each quietly depending on assumptions nobody wrote down.
Start With the Contract, Not the Connector
The instinct is to start with the connectors. Pull from the CRM, pull from billing, pull from the ad platforms, dump everything into a warehouse, sort it out later. Works for about a month. Then two sources disagree about what a "customer" is, and nobody can say which one's right.
A better starting point is the contract between producers and consumers of the data. What fields exist, what types they carry, what null means, how late a record can arrive before it counts as an error. Write that down before writing a single line of ingestion code. It feels slow. It saves weeks, because most pipeline bugs aren't code bugs. They're disagreements about meaning that nobody surfaced until the numbers looked wrong.
Make Every Load Safe to Run Twice
Sources fail. Networks drop. A job times out at 3 a.m. and gets retried, and now half the day's records exist twice. Idempotent loads fix this by design. Key every record on something stable, upsert instead of append, and a retry becomes boring instead of dangerous. It's one of the cheapest reliability wins in data engineering, and skipping it is one of the most expensive mistakes to fix later, because duplicated data looks plausible right up until someone reconciles it.
Messy Sources Are the Hard Part, Not the Volume
Engineers often plan for scale first. Terabytes, throughput, partitioning. Those matter, but in most SaaS analytics the real difficulty is mess, not size. Data arrives from systems built by different vendors, for different purposes, with different ideas about identifiers, currencies, time zones, and naming.
Spend data is a good example. Take a platform like Suplari.com Spend Analytics, which brings procurement, contract, and financial records into one continuous view. The hard engineering isn't storing the rows. It's that the same supplier appears under five spellings across three systems, invoices carry inconsistent category codes, and contract terms live in documents rather than tables. Before any insight is possible, someone has to normalize, deduplicate, classify, and reconcile all of it, and keep doing that as new records land every day. Notice how much of that work is entity resolution and classification rather than raw throughput. Plan for it early, because it's usually where the schedule slips.
Snapshots Age Badly, So Design for Continuous Updates
A quarterly export is easy to build and stale on arrival. By the time anyone reads it, the situation it describes has moved on. Designing for continuous or near-real-time ingestion is harder up front, since you need incremental loads, change data capture, and a plan for late-arriving and corrected records. But it turns the output from a report about the past into something people can act on while it still matters. For most decision-support use cases, freshness is worth more than another decimal of precision.
Downstream Consumers Set the Real Requirements
A pipeline should be shaped by what reads from it. The fastest way to build the wrong thing is to model data in the abstract and hope consumers adapt. Ask what the heaviest downstream use needs, then work backward.
Marketing measurement makes this concrete. The best mmm tools for e-commerce brands run marketing mix models, which estimate each channel's real contribution to revenue from aggregate data rather than tracking individual users. That approach is more durable as privacy rules tighten, but it's demanding on the inputs. It wants consistent daily or weekly spend by channel, aligned revenue and order data, promotions and pricing changes flagged, and a long enough history to separate seasonality from genuine effects, often two years or more.
Feed a model gap, backfilled numbers that quietly changed, or a channel taxonomy that got renamed halfway through, and the output looks confident and means nothing. Which is the point worth taking from it. A modeling tool can only be as good as the pipeline behind it, so whoever owns the pipeline owns a large share of the model's credibility.
Version Your Definitions Like You Version Your Code
Metrics drift. "Active user" means one thing in January and something slightly different by June, after a product change nobody connected to analytics. Store metric definitions in code, review them like any other change, and keep history so old numbers stay explainable. When a stakeholder asks why last quarter's figure moved after a re-run, you want an answer that points to a commit, not a shrug.
Observability Isn't Optional
Most data failures are silent. The job succeeds, the table updates, and the numbers are wrong. Monitoring only for job failure misses almost everything that matters. Watch row counts against expectations, freshness of each source, null rates on key fields, and distribution shifts in the values that feed important metrics. Alert on the data, not just the process.
Add lineage while you're at it. When a number looks off, being able to trace it back through each transformation to the raw source turns a day of guessing into a twenty-minute investigation. It's tedious to set up and enormously valuable the first time something breaks in production.
What Good Architecture Feels Like From the Outside
Users never see the contracts, the idempotent loads, or the lineage graph. What they experience is simpler. Numbers that match across screens. Reports that don't change after they've been read. Answers that arrive fast enough to matter. Good pipeline design is mostly invisible, which is exactly why it's undervalued until it's missing.
The Number Someone Trusts
Go back to the dashboard nobody trusts. Trust isn't a feature you add at the end with better charts. It's the accumulated result of a hundred small decisions about definitions, retries, freshness, and monitoring, made before anyone asked. Teams that treat those decisions as real engineering work end up with analytics customers rely on. The rest end up explaining, again, why two numbers don't match.
FAQs
Should I use ETL or ELT for a SaaS analytics pipeline? ELT is the common default now, since modern warehouses handle transformation well and keeping raw data lets you reprocess when definitions change. ETL still makes sense when you must filter or mask sensitive fields before data lands.
How much history does a marketing mix model need? Usually at least two years of weekly or daily data, so the model can tell seasonality apart from real channel effects. Shorter histories can work but produce less stable results.
What's the first thing to fix in a pipeline nobody trusts? Make loads idempotent and add basic monitoring on row counts and freshness. Those two changes catch and prevent a large share of the silent errors that erode trust.