Imagine your team ships a dashboard that works perfectly on 200 rows of demo data. A client loads 200,000 rows, and the browser locks up. Tickets pile in, and the library you chose in the afternoon is now everyone's problem.
A chart library looks like a small choice early on. It isn't. That one decision reaches into performance, accessibility, licensing, framework fit, and years of maintenance. Choose popularity, and you buy technical debt you can't easily pay down.
This guide takes the decision apart, one factor at a time. You'll see why enterprise needs differ, and which criteria actually matter. By the end, you can test any library against your real requirements instead of the hype.
Why Enterprise Applications Have Different Requirements
Enterprise software isn't a weekend project. It drives the reporting leadership needs to read before the morning is over. When a chart breaks, decisions stall, and the numbers behind them slip.
You're also serving multiple audiences through a single interface. Analysts, executives, auditors, and customers each want something different from the same view. That tension sits behind every technical decision you make.
This is where custom software development services become particularly valuable, allowing organizations to build applications around their specific workflows, security requirements, and integration needs rather than forcing complex operations into generic solutions.
Then there's the lifespan. Enterprise products run for years, sometimes a decade. Regulations and SLAs push the bar higher than any internal tool has to clear.
So maintainability beats novelty when the timeline runs this long. A clever library with thin documentation can turn into a liability within a couple of years.
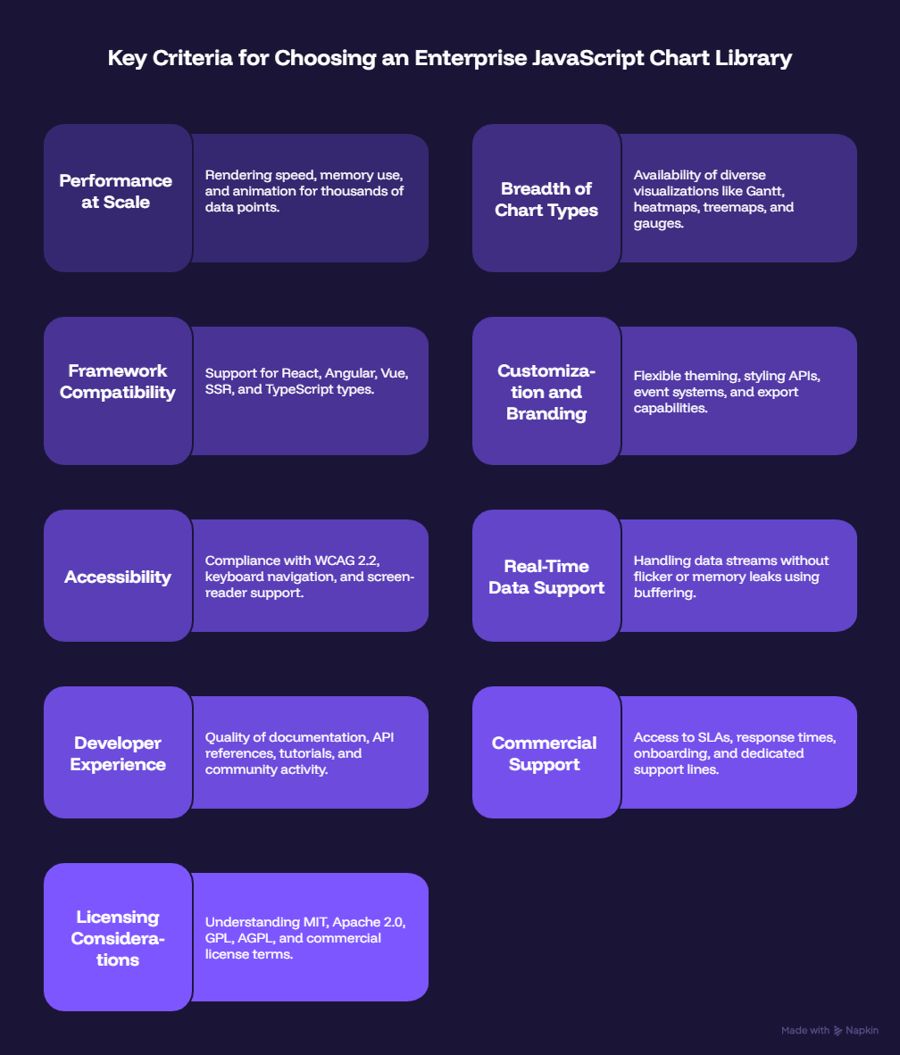
Key Criteria for Choosing an Enterprise JavaScript Chart Library
These are the criteria for choosing an enterprise JavaScript chart library:
Performance at Scale
Performance breaks first. Enterprise dashboards routinely draw thousands of points in one view, so rendering speed, memory use, and animation all matter.
This is where Canvas and SVG part ways. Canvas paints to a bitmap and handles large, fast-changing datasets well. SVG builds a DOM node per shape, which helps interactivity but drags once you pass a few thousand elements.
Neither wins outright. Reach for Canvas on dense data views and SVG on smaller interactive ones. Many libraries mix both, so you never touch the rendering layer yourself.
For hard numbers, MDN, web.dev, and Chrome for Developers publish solid rendering benchmarks.
Breadth of Chart Types
Line, bar, and pie cover the basics. Enterprise reporting rarely stops there.
You'll want Gantt charts for timelines, heatmaps for density, and treemaps for hierarchy. Finance teams ask for candlestick and OHLC charts. Operations teams need gauges, funnels, Sankey diagrams, maps, and time-series views.
Check the full catalog before you commit, because swapping libraries later to get one chart type hurts. New to this? This primer on what a JavaScript charting library does[a] is a good start.
Framework Compatibility
Your library has to fit your stack, not fight it. Confirm real support for React, Angular, and Vue first.
Next.js and Nuxt need charts that survive SSR and hydration. Strong TypeScript types catch errors before they reach production, which matters on a big team.
Customization and Branding
Enterprise dashboards have to match the brand down to the pixel. Look for flexible theming, a clean styling API, and config you can reuse across products.
You also need behavior, not just looks. A good event system powers drill-down, annotations, and cross-chart interactions. Export to PDF and image, plus a responsive layout, is the baseline for reports.
Accessibility
Accessibility isn't optional in enterprise software. In many markets it's the law.
Target WCAG 2.2, with Level AA as the practical bar. The ADA, Section 508, and the European Accessibility Act all point there. Your charts need keyboard navigation, ARIA attributes, and working screen-reader support.
Your rendering choice decides a lot of this. MDN says to avoid Canvas for accessible content, since it exposes nothing to assistive tools. SVG lives in the DOM and carries meaning, so screen readers read it.
Real-Time Data Support
Real-time data support matters for enterprise applications such as monitoring dashboards, trading platforms, and IoT systems. When evaluating a JavaScript chart library, check whether it provides APIs for adding new data without rebuilding the entire visualization and whether it can manage the amount of historical data displayed as updates continue.
For example, FusionTime[b] provides the feedData() API for adding new rows to an existing time-series chart. It also supports timeSpread, which lets you control the time interval displayed as new data arrives.
The following example shows how data received through a WebSocket could be passed to an existing FusionTime chart:
const socket = new WebSocket("wss://example.com/live-metrics");

socket.addEventListener("message", (event) => {
  try {
    const point = JSON.parse(event.data);

    if (point.timestamp == null || typeof point.value !== "number") {
      console.warn("Invalid data point received:", point);
      return;
    }

    // Add the new row to the existing FusionTime chart.
    fusionTimeChart.feedData([
      [point.timestamp, point.value]
    ]);
  } catch (error) {
    console.error("Error processing WebSocket data:", error);
  }
});

socket.addEventListener("error", (error) => {
  console.error("WebSocket error:", error);
});
Here, fusionTimeChart represents an already-created FusionTime chart instance. Each row passed to feedData() must follow the schema used when the chart was created. FusionTime then updates the visualization, including relevant chart components such as axes, legends, and the time navigator.
For a continuously updating dashboard, you can also configure a visible time window:
const dataSource = {
  chart: {
    timeSpread: {
      unit: "minute",
      multiplier: 10
    }
  }
};
Documentation and Developer Experience
Good docs save weeks. Read the API reference and run a few tutorials before you commit.
Check the ecosystem too. An active repo, recent releases, and answered Stack Overflow questions tell you help exists when you're stuck.
Commercial Support vs Community Support
Open-source libraries run on community goodwill. That's flexible, but fixes land on the maintainer's schedule, not yours.
Commercial libraries sell certainty: SLAs, response times, onboarding, and a support line. When a broken chart holds up a client deliverable, that line earns its cost.
Licensing Considerations
Licensing decides what you can ship. MIT and Apache 2.0 are permissive, so you can use, modify, and distribute freely. Apache 2.0 adds a patent grant that MIT leaves out.
Copyleft works differently. The GPL requires any distributed derivative to stay open source. AGPL goes further and covers software you only host as a service.
Commercial licenses trade that ambiguity for a fee. Bring in legal early, and treat this as general information, not legal advice.
Questions to Ask Before Choosing a Chart Library
Run this checklist with your team before you decide:
- Will the app need to display millions of records at once?
- Do we need advanced charts like Gantt, Sankey, funnels, or financial types?
- Which framework and version are we standardizing on?
- Will we need commercial support backed by SLAs?
- How important is accessibility and WCAG conformance for us?
- Will dashboards update in real time?
- Do we need PDF or image export?
- How long is this application expected to live?
- Is the library actively maintained, with recent releases?
- Are there licensing costs that appear only as we scale?
Answer honestly, and the shortlist writes itself.
Common Mistakes Teams Make
Strong teams still fall into the same traps. Watch for these:
- Choosing on GitHub stars alone, which rarely reflects fit for your case.
- Ignoring licensing until a legal review blocks the release.
- Skipping performance testing on realistic data instead of toy datasets.
- Treating accessibility as an afterthought you pay to retrofit later.
- Adding too many libraries, which bloat the bundle and fragment the codebase.
- Ignoring maintenance, forgetting someone owns this in year three.
- Skipping a proof-of-concept, where the real limits show up.
Each one is cheap to dodge now and expensive to fix later.
Example Evaluation Matrix
Score each candidate against the same weighted criteria. A simple matrix keeps the decision honest:
| Criteria | Importance |
|---|---|
| Performance at Scale | High |
| Framework Support | High |
| Accessibility | High |
| Chart Variety | High |
| Customization | High |
| Licensing | High |
| Documentation | Medium |
| Commercial Support | Medium |
Weight these for your own context. A public-sector app puts accessibility on top; a trading platform puts real-time speed there instead.
Conclusion
Here's the takeaway. Judge chart libraries on long-term maintainability, not short-term popularity.
The right one balances performance, scalability, accessibility, support, licensing, and developer experience. None wins every category, so weigh them against what you actually need.
Before you commit, build a proof of concept using your real data, framework, and performance requirements. If you’re still comparing your options, explore our guide to the best JavaScript charting libraries for data visualization[c] to see how leading libraries compare.