
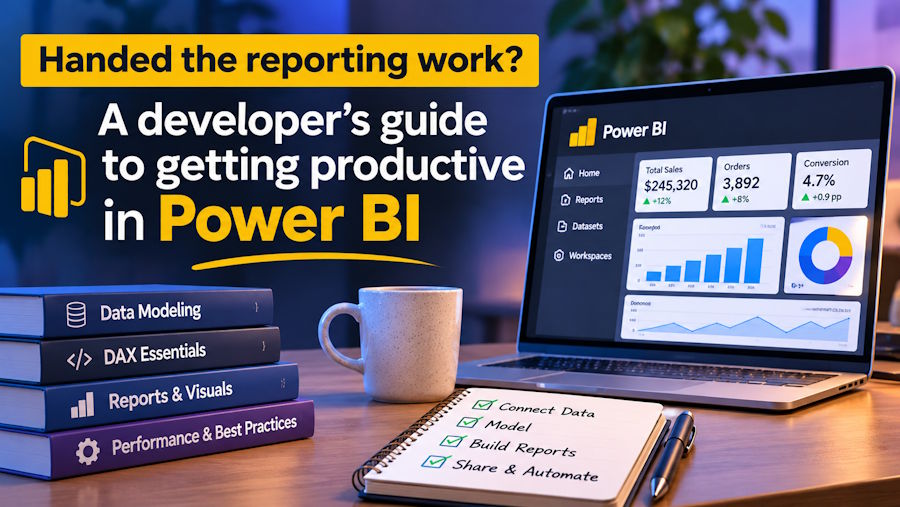
The request usually arrives as a ticket with a short description. Sales wants a dashboard showing pipeline by region and month, and since you're the one who knows SQL, it has landed in your queue. In smaller companies this happens a lot, because the developer is often the person closest to the data, and Microsoft Power BI is very likely the reporting tool the business has already chosen.
Power BI is Microsoft's business intelligence platform. It connects to databases, files and online services, then turns the results into interactive reports that people open in a browser or on their phone. Microsoft reports more than 30 million monthly active users across Power BI and its sister platform Fabric, and Gartner has named Microsoft a Leader in its analytics and business intelligence rankings for 18 years running. For a developer, that scale brings plenty of documentation and community answers, along with colleagues who'll be keen to see results quickly.
What carries over from your day job
A good share of your existing skills transfer directly. If you can write a join and reason about data types, the import side of Power BI will feel familiar. Power Query, the data preparation layer, records every transformation as a step in a language called M, so you can open the generated code and edit it by hand when the point-and-click interface gets in the way. Your habit of thinking about upstream systems pays off too, because the first time someone renames a column in the CRM, you'll already have guessed which report breaks.
Developers often want to do everything in SQL views before the data reaches Power BI, and for heavy work on large tables that instinct serves you well. Lighter shaping, such as renaming columns, splitting a field or merging a lookup file that someone keeps in SharePoint, sits more comfortably in Power Query, where the analysts who come after you can see and change it.
Source control carries over as well. Power BI Desktop can save work in a project format that stores the report and model as text files, which means they can live in a Git repository, show up in pull requests and be compared line by line. If your team already reviews code, you can extend the same habit to reports, which keeps changes visible once more people start contributing.
The parts that feel strange
A few ideas trip up experienced programmers, and knowing about them in advance shortens the learning curve considerably.
Modelling comes first. Power BI performs best with a star schema, a layout where one central fact table holds the events you're measuring (orders, invoices, support tickets) and smaller dimension tables around it describe those events (customers, products, dates). Normalised application databases look nothing like this, so part of the job is reshaping a transactional design into something built for analysis. A dedicated date table, marked as such in the model, sits at the centre of nearly every useful report.
Then there's DAX, short for Data Analysis Expressions, the formula language used for calculations. DAX looks like spreadsheet formulas, yet it behaves according to filter context, meaning each measure is evaluated against whatever filters happen to apply at that moment, whether they come from the page, the visual or a user's click. A measure for total sales returns a different number in each cell of a matrix without you writing a loop. Once that idea clicks, functions such as CALCULATE, which changes the filters a measure runs under, start to make sense, although getting there can take a while for anyone used to imperative code.
Report design for non-technical readers is the last adjustment. A page that answers the question but needs a walkthrough every time someone opens it won't get much use. Sensible defaults go a long way, starting with a clear headline number at the top left and filters placed where people expect to find them.
Learning it without stalling
A first report comes together quickly. The slower stretch comes afterwards, when the model has to handle time comparisons, several fact tables and users who each need to see a different slice of the data. Structured teaching saves the greatest amount of time at that point, because someone can explain why a measure misbehaves in your particular model.
A practitioner-led Power BI course from Red Eagle Tech, a Microsoft Partner in London, covers that ground over two consecutive days, delivered live on Microsoft Teams. The seven modules move through Power Query and the M language, data modelling, DAX with time intelligence, report design, row-level security and publishing to a Microsoft 365 environment. Each topic is demonstrated first and then built by the attendees on real datasets, and the trainer previously ran Power BI training for staff throughout a FTSE 100 company. The course is aligned to the syllabus for Microsoft's PL-300 certification (Power BI Data Analyst) while being designed as a practical skills course, which suits developers who want working knowledge first and a certificate later, if at all.
When the dashboard turns into a product
Some reporting requests grow. A single dashboard for the sales director becomes a set of reports for forty people across several regions, each of whom should see only their own figures, all refreshing overnight from three systems. By then the work involves capacity planning, deployment between test and production workspaces, licensing decisions and performance tuning on models with millions of rows.
That's a substantial body of work to carry alongside a development role. If your main job is building the company's software, bringing in a specialist for the reporting build keeps both moving and gets the business a well-designed model from the start. The Power BI consulting team at Red Eagle Tech offers that kind of help, whether that's a short review of the reports you already have or a first dashboard delivered within about two weeks, with every engagement priced as a fixed quote agreed before work begins. Their consultants also train the people who will maintain the reports, so the business ends up with something it understands and can extend.
A sensible first week
If the ticket is already in your queue, here's a practical plan for the first week. Pick one fact table and build a proper date table alongside it before touching any visuals. Write five measures that answer the questions in the ticket, check each one against a figure the business already trusts, and only then design the page. Publish it to a shared workspace, ask the person who raised the request to try it without you in the room, and write down every question they ask, since each one points at either a model change or a design change for version two.