
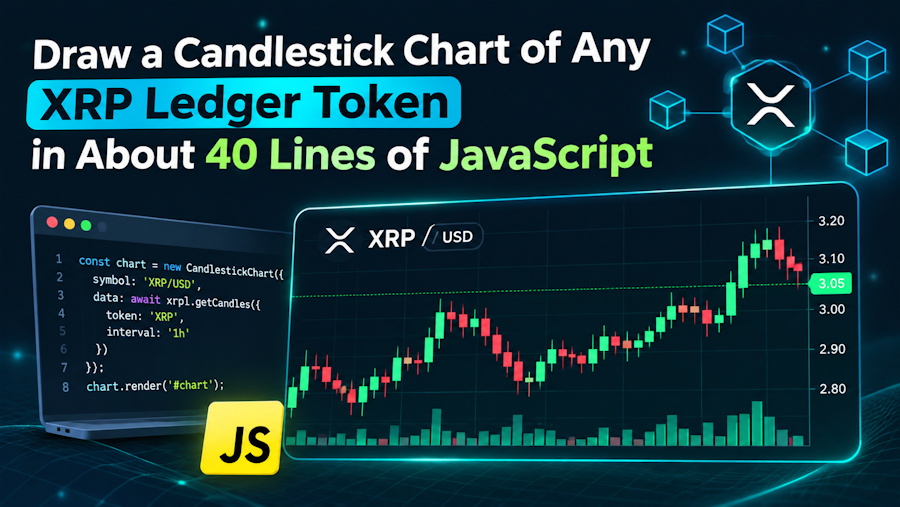
A price chart is the first thing most people look for when they check a token, and the standard way to draw one is the candlestick chart. Each candle covers one period, such as a day, and shows four prices: where trading opened, where it closed, and the highest and lowest prices in between.
Charting libraries can draw this for you, but they are large, and the idea is simple enough to build from scratch. This tutorial draws a candlestick chart of any token traded on the XRP Ledger as an SVG file, in about 40 lines of plain JavaScript, with no packages and no API key.
Where the candles come from
The XRP Ledger has a built-in exchange, so every trade made on it is public. A free market-data API collects those trades into candles, and one request returns a token's whole price history in that form:
The response is JSON with an ohlc array. Each element is one candle, written as [time, open, high, low, close, volume], where time is the moment the candle opens, in Unix milliseconds (UTC). The range parameter runs from 1D to ALL, interval from 1m to 1w, and vs_currency sets the currency the prices are quoted in: XRP by default, or USD, EUR, JPY or CNH. The guide to the XRP Ledger OHLC price API lists every parameter, including how to page back through years of history a fixed number of candles at a time.
Finding a token's id
The {token} part of the address is the token's id. XRP has a fixed one, 84e5efeb89c4eae8f68188982dc290d8, and the script below uses it when you give it nothing else. For any other token, the easiest id to find is its slug: open the token's page on XRPL.to and copy everything after /token/ in the address bar. The RLUSD price page, for example, ends in rMxCKbEDwqr76QuheSUMdEGf4B9xJ8m5De-524C555344000000000000000000000000000000. That is the account that issues the token, a dash, and the currency code written in hexadecimal. The whole string is the id.
The script
You need Node.js 18 or newer, which has fetch built in. Save this as chart.mjs:
import { writeFile } from "node:fs/promises";

const TOKEN = process.argv[2] || "84e5efeb89c4eae8f68188982dc290d8"; // XRP
const url = `https://api.xrpl.to/v1/ohlc/${TOKEN}?range=3M&interval=1d&vs_currency=USD`;

const res = await fetch(url, { headers: { "User-Agent": "candle-chart/1.0" } });
if (!res.ok) throw new Error(`HTTP ${res.status}`);

const { ohlc } = await res.json();
if (!ohlc?.length) throw new Error("No candles for this token");

const W = 900, H = 420, PAD = 60;
const max = Math.max(...ohlc.map((c) => c[2]));
const min = Math.min(...ohlc.map((c) => c[3]));
const y = (price) => PAD + ((max - price) / (max - min || 1)) * (H - 2 * PAD);
const step = (W - 2 * PAD) / ohlc.length;

let shapes = "";
ohlc.forEach(([time, open, high, low, close], i) => {
  const x = PAD + i * step + step / 2;
  const color = close >= open ? "#16a34a" : "#dc2626";
  const top = y(Math.max(open, close));
  const height = Math.max(1, Math.abs(y(open) - y(close)));
  shapes += `<line x1="${x}" x2="${x}" y1="${y(high)}" y2="${y(low)}" stroke="${color}"/>`;
  shapes += `<rect x="${x - step * 0.3}" y="${top}" width="${step * 0.6}" height="${height}" fill="${color}"/>`;
});

for (let k = 0; k <= 4; k++) {
  const price = min + ((max - min) * k) / 4;
  shapes += `<text x="${W - PAD + 8}" y="${y(price) + 4}" font-size="12">${price.toPrecision(4)}</text>`;
}

const day = (ms) => new Date(ms).toISOString().slice(0, 10);
Run it with no argument to chart XRP, or pass a token id:
It writes chart.svg next to the script. Open that file in any browser.
How it works
The request sets a User-Agent header, and that line matters. Node's fetch identifies itself simply as "node", and the API's network edge refuses that with a 403 error. Any descriptive name for your app gets through.
The drawing is all arithmetic. The script finds the highest high and the lowest low in the data, and the y function maps any price onto the image: the highest high lands at the top margin, the lowest low at the bottom one, and everything else in proportion. The || 1 in that function keeps it from dividing by zero if a token's price never moved. The chart's width is split into one equal slot per candle. In each slot, a thin line runs from the low to the high, which is the wick, and a rectangle runs from the open to the close, which is the body. The body is green when the candle closed at or above its open and red when it closed below. Every body is at least one pixel tall, so a candle that opened and closed at the same price still shows up.
The labels come last. Five prices are spread up the right-hand side, formatted with toPrecision(4), which works for XRP at around a dollar and for small tokens priced in fractions of a cent, switching to exponent notation for very small numbers. The first and last candle dates sit along the bottom. The white rectangle behind everything keeps the chart readable in image viewers with a dark background.
Read the axis before the shape
Try RLUSD, a dollar stablecoin. Its candle bodies sit on a line at about one dollar, yet the chart still looks busy. The reason is the axis: it runs from the lowest low to the highest high, and a few long wicks, each a moment when a trade printed several cents away from a dollar, stretch it until a narrow range fills the whole image. When this was written, a three-month chart of RLUSD had an axis almost ten cents tall, while every one of its candle bodies stayed within a cent of one dollar.
Every auto-scaled chart behaves this way, so read the price labels before you read the shape. If you would rather tame it, scale the axis to the bodies instead of the wicks, or fix the axis around a reference price, for example one dollar for a stablecoin.
Taking it further
The sixth number in each candle is the volume. Scale it the same way as the prices and draw it as bars along the bottom, and the chart shows when a move came with real trading behind it. For hourly candles, ask for interval=1h with range=7D. For prices in XRP rather than dollars, change vs_currency to XRP. A moving average is a few more lines: average the last 20 closes at each candle and join the points with an SVG polyline. Because the output is plain SVG and the API accepts requests from any website, the drawing code also runs in a browser: remove the User-Agent header (the browser sends its own), take the token id from your page instead of process.argv, and put the SVG string into an element's innerHTML instead of writing a file.
A few rules worth knowing
Anonymous access works, but requests are rate-limited. If you get a 429 response, wait for the time in its Retry-After header instead of retrying at once, and get a free key if you need more. Any page that shows the data publicly must credit the source with a visible link. And remember what a chart is: a record of what traded. On a thin market a single trade can draw a long wick, so a candle tells you what happened, not what will.
Building the chart yourself takes less code than learning most charting libraries, and once you can draw one token, you can draw any of them.
XRPL.to is a market-data explorer and trading site for the XRP Ledger with a public API.