
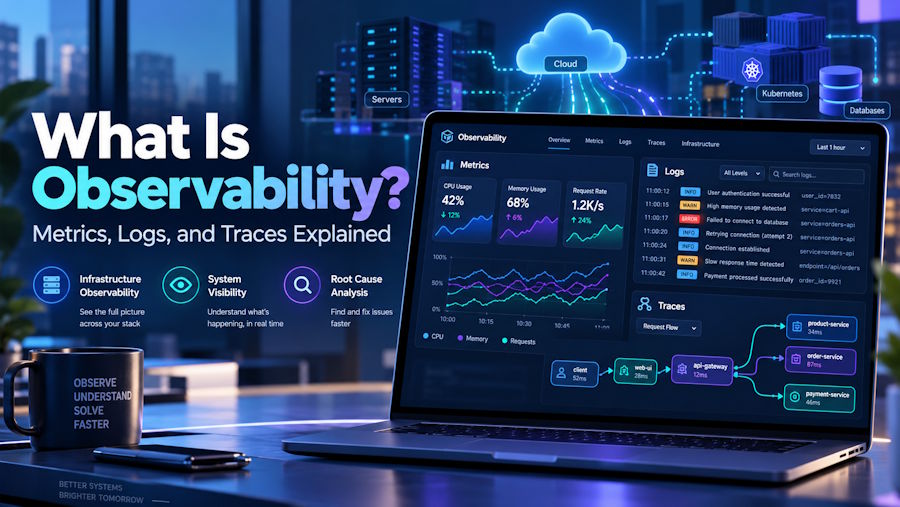
Modern applications depend on interconnected servers, databases, cloud platforms, and microservices. When something goes wrong, finding the exact cause can become difficult, especially when multiple systems are involved.
Imagine an e-commerce website suddenly becoming slow. Traditional monitoring might reveal increased CPU usage or application errors, but it may not explain which service caused the slowdown.
This is where observability becomes essential.
What is observability? Observability is the ability to understand a system's internal behavior by analyzing the data it produces, including metrics, logs, and traces. It helps IT teams investigate performance problems, identify root causes, and improve system reliability.
This guide explains how observability works, its three main pillars, and why it matters for modern IT infrastructure.
What Is Observability in IT?
Observability in information technology refers to understanding the internal state and behavior of applications and infrastructure through measurable outputs.
These outputs, commonly called telemetry data, provide information about system health, activity, and performance.
Observability helps answer important operational questions:
- Why is an application responding slowly?
- Which service is causing an error?
- Where is infrastructure performance declining?
- How are different system components affecting one another?
- What changed before an unexpected failure?
Unlike basic monitoring, observability allows engineering teams to investigate unexpected problems without knowing every possible failure in advance.
It is particularly useful for cloud environments, distributed applications, and microservices architectures.
What Are the Three Pillars of Observability?
The three traditional pillars of observability are metrics, logs, and traces.
Each provides a different perspective on system behavior. Together, they give IT teams a more complete understanding of application and infrastructure performance.
1. Metrics: Understanding System Performance
Metrics are numerical measurements collected over time to describe the performance or condition of a system.
They help engineers identify trends, monitor resource usage, and detect unusual activity.
Common observability metrics include:
- CPU and memory utilization
- Network traffic
- Application response time
- Request rates
- Error rates
- Database connection counts
For example, if server CPU usage increases from 35% to 95%, monitoring dashboards can reveal when the change occurred.
Metrics are particularly valuable for identifying performance patterns and creating automated alerts.
However, metrics alone may not explain the underlying cause of a problem.
2. Logs: Understanding System Events
Logs are timestamped records of events occurring within applications, servers, and infrastructure components.
They capture operational details such as successful requests, authentication attempts, errors, and system activities.
Logs help developers investigate application failures, examine operational events, and troubleshoot unexpected behavior.
3. Traces: Tracking Requests Across Services
Traces follow individual requests as they move through different components of an application.
They are particularly important for distributed systems where a single user action may involve multiple services.
Consider an online purchase involving a website, payment service, inventory database, and order-processing system.
A distributed trace can show how long each component takes to process the request.
If the checkout process becomes slow, engineers can identify which service contributes most to the delay.
Traces provide context that individual metrics and logs may not reveal.
Metrics vs Logs vs Traces: Key Differences
| Feature | Metrics | Logs | Traces |
|---|---|---|---|
| Data type | Numerical measurements | Event records | Request journeys |
| Primary purpose | Track performance | Investigate events | Analyze request flow |
| Example | CPU usage at 90% | Database timeout | Slow payment service |
| Main advantage | Trends and alerts | Detailed context | Service-level visibility |
| Common use | Infrastructure health | Error troubleshooting | Distributed applications |
These signals are most valuable when teams can correlate them.
For example, metrics may detect increased latency, traces may identify the affected service, and logs may reveal the underlying error.
Why Infrastructure Observability Matters
Infrastructure observability allows organizations to understand the performance and health of the systems supporting their applications.
Modern infrastructure may include physical servers, virtual machines, cloud resources, containers, databases, and networking components.
Observability provides visibility across these environments, helping IT teams investigate operational problems more efficiently.
Faster Problem Identification
Observability can help engineers identify abnormal behavior before it develops into a larger service disruption.
Instead of manually checking individual systems, teams can investigate correlated telemetry data.
Better Application Reliability
Tracking response times, error rates, and resource consumption helps organizations understand how applications behave under different workloads.
This information supports performance improvements and capacity planning.
Improved Troubleshooting
Distributed applications create challenges because failures can originate from multiple connected services.
Infrastructure observability helps engineers narrow down possible causes and reduce time spent investigating incidents.
More Efficient Resource Management
Monitoring resource utilization can reveal underused infrastructure, overloaded services, and inefficient configurations.
These insights can support better infrastructure planning and cost management.
Observability vs Monitoring: What's the Difference?
Monitoring and observability are closely related, but they address different operational needs.
Monitoring identifies known conditions, such as server downtime, high memory usage, or an unavailable application endpoint.
Observability supports deeper investigation, helping engineers understand why unexpected conditions occur.
For example, monitoring may trigger an alert when application response time exceeds a predefined threshold.
Observability allows engineers to investigate the related request traces, error logs, and infrastructure metrics to understand the cause.
Monitoring therefore forms an important part of observability, rather than representing a completely separate activity.
How to Compare Observability Platforms for Logs, Metrics, and Traces
Businesses looking to compare observability platforms for logs metrics and traces should evaluate more than dashboard appearance or the number of available integrations.
The right platform should support the technical requirements of the organization's applications and infrastructure.
Data Collection and Integration
Check whether the platform can collect telemetry from existing applications, servers, databases, and cloud services.
Compatibility with recognized standards such as OpenTelemetry can make integration across different technologies easier.
Scalability and Data Storage
Growing applications generate increasing volumes of telemetry data.
Organizations should evaluate storage efficiency, query performance, retention policies, and the infrastructure required to manage this information.
Correlation and Troubleshooting
A useful observability platform should make it practical to investigate relationships between metrics, logs, and traces.
This helps engineering teams move from detecting an issue to understanding its cause.
Deployment and Operating Costs
Observability platforms may use self-hosted, managed, or hybrid deployment models.
Businesses should consider infrastructure costs, maintenance effort, data ingestion, retention, and technical support.
For example, VictoriaMetrics observability solutions include VictoriaMetrics for time-series metrics, VictoriaLogs for log management, and VictoriaTraces for distributed tracing data. These components can support different parts of an observability architecture.
Best Practices for Building Observability Infrastructure
Effective observability infrastructure requires a clear strategy for collecting, processing, storing, and analyzing telemetry data.
Define Meaningful Performance Indicators
Identify the measurements that reflect application reliability and user experience.
Common examples include request latency, error rates, traffic, and resource saturation.
Use Open Standards
OpenTelemetry provides a vendor-neutral framework for generating, collecting, and exporting observability data.
Using open standards can simplify integration and reduce dependence on proprietary instrumentation.
Create Actionable Alerts
Avoid generating alerts for every minor change in system behavior.
Prioritize conditions that require investigation or immediate action.
Manage Telemetry Volume
Collect information that supports troubleshooting and operational decisions.
Apply suitable data retention policies to control storage requirements and costs.
Protect Sensitive Information
Telemetry may contain application identifiers, operational details, or sensitive user information.
Organizations should apply access controls, encryption, and data-minimization practices.
How Observability Supports Cloud and Kubernetes Environments
Cloud-native applications often operate across multiple containers, nodes, and services.
When applications scale dynamically, traditional host-level monitoring may not provide enough context.
Kubernetes observability helps teams understand cluster health, container performance, application behavior, and service interactions.
Metrics can reveal resource saturation, logs can explain container errors, and traces can show delays between connected microservices.
The Kubernetes documentation specifically identifies collecting and correlating these signals as fundamental to understanding cluster performance.
Frequently Asked Questions
What is observability in simple terms?
Observability is the ability to understand what is happening inside a software system by examining its metrics, logs, traces, and other operational information.
What are the three pillars of observability?
The three traditional pillars are metrics, logs, and traces. Metrics measure performance, logs record events, and traces track requests across services.
Why is observability important in DevOps?
Observability helps DevOps teams investigate failures, understand application behavior, improve reliability, and manage complex infrastructure.
Is observability the same as monitoring?
No. Monitoring typically detects predefined conditions, while observability supports investigating both expected and unexpected system behavior.
Which tools are used for observability?
Common technologies include OpenTelemetry for instrumentation, Prometheus-compatible systems for metrics, Grafana for visualization, and specialized platforms for storing and analyzing telemetry data.
Conclusion
Understanding what is observability is increasingly important as businesses adopt cloud infrastructure, distributed applications, and microservices.
Metrics, logs, and traces provide complementary information about system behavior. Metrics reveal performance trends, logs provide event details, and traces show how requests move between services.
Together, these signals help engineering teams identify problems, investigate their causes, and improve operational reliability.
For organizations building modern observability infrastructure, the priority should be collecting meaningful telemetry, adopting interoperable tools, and creating processes that turn technical data into actionable insights.