
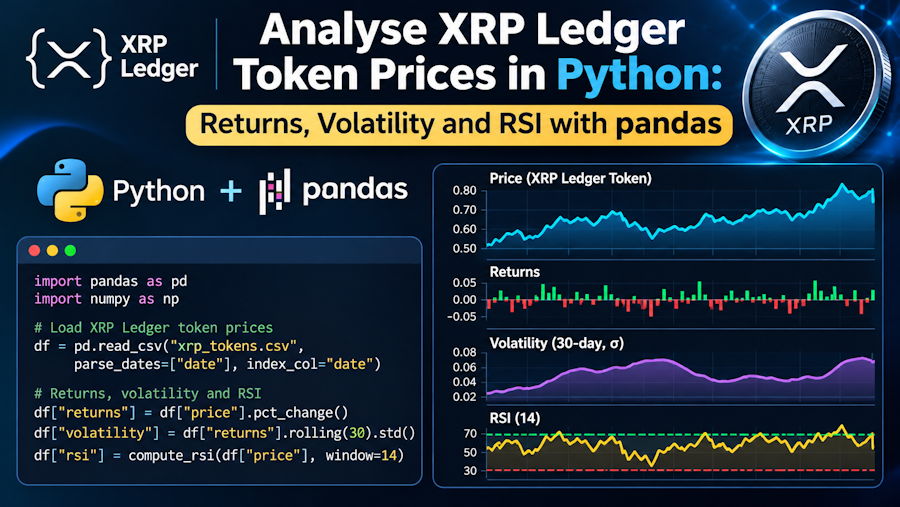
Most price analysis starts with the same few numbers: how much an asset moved, how much it swings from day to day, how far it has fallen from its last peak, and whether recent moves have been unusually one-sided. With pandas, each of these is a line or two of code once the price history is in a DataFrame. This tutorial pulls a year of daily prices for a token on the XRP Ledger from a free API and computes daily returns, a moving average, annualised volatility, the worst drawdown and the 14-day RSI. Then it checks the RSI against an independent calculation, which is a habit worth keeping for any indicator you code yourself.
Getting the data
Every trade on the XRP Ledger's built-in exchange is public, and a free market-data API turns those trades into candles: for each period, the open, high, low and close price and the volume. One request returns a year of daily candles in US dollars:
https://api.xrpl.to/v1/ohlc/84e5efeb89c4eae8f68188982dc290d8?range=1Y&interval=1d&vs_currency=USD
The long string in the address is the id of XRP itself. Any other token works the same way with its own id or its slug, the part after /token/ in the address of its page on XRPL.to. The guide to XRP Ledger historical token data covers the other options, from a CSV download of the chart to paging back through a token's full history.
The answer is JSON with an ohlc list, and each item is one candle written as [time, open, high, low, close, volume], with the time in Unix milliseconds at the moment the candle opens.
What you need
Python 3 and pandas. Nothing else, because the request uses urllib from the standard library:
pip install pandas
The script
Save this as study.py and run it with python study.py:
import json
import urllib.request

import pandas as pd

TOKEN = "84e5efeb89c4eae8f68188982dc290d8"  # XRP
URL = f"https://api.xrpl.to/v1/ohlc/{TOKEN}?range=1Y&interval=1d&vs_currency=USD"

request = urllib.request.Request(URL, headers={"User-Agent": "price-study/1.0"})
with urllib.request.urlopen(request, timeout=30) as response:
    candles = json.load(response)["ohlc"]

df = pd.DataFrame(candles, columns=["time", "open", "high", "low", "close", "volume"])
df["time"] = pd.to_datetime(df["time"], unit="ms", utc=True)
df = df.set_index("time")

df["return"] = df["close"].pct_change()
df["ma20"] = df["close"].rolling(20).mean()

change = df["close"].diff()
gain = change.clip(lower=0).ewm(alpha=1 / 14, adjust=False).mean()
loss = (-change.clip(upper=0)).ewm(alpha=1 / 14, adjust=False).mean()
df["rsi14"] = 100 - 100 / (1 + gain / loss)

drawdown = df["close"] / df["close"].cummax() - 1

print(f"{len(df)} daily candles, {df.index[0]:%Y-%m-%d} to {df.index[-1]:%Y-%m-%d}")
print(f"Change over the year:  {df['close'].iloc[-1] / df['close'].iloc[0] - 1:+.1%}")
print(f"Annualised volatility: {df['return'].std() * 365 ** 0.5:.1%}")
print(f"Worst drawdown:         {drawdown.min():.1%}")
print(f"RSI(14) today:          {df['rsi14'].iloc[-1]:.1f}")
print(df[["close", "ma20", "rsi14"]].tail().round(4))
How it works
The request sets a User-Agent header. Without one, urllib introduces itself as Python-urllib and the API refuses the request with a 403 error, so give your script a name.
The candles go straight into a DataFrame with named columns. pd.to_datetime turns the millisecond timestamps into dates in UTC, and making the time the index means every later calculation lines up by date.
The daily return is pct_change on the closing price: today's close divided by yesterday's, minus one. The 20-day moving average is a rolling mean over the same column, and its first 19 values are empty because there is not yet a full window behind them.
Volatility is the standard deviation of the daily returns, scaled to a year. Stock markets use the square root of 252 trading days for that; the XRP Ledger trades every day, so the script uses 365.
The drawdown compares each close with the highest close so far, which cummax provides. Its minimum is the worst fall from a previous peak in the period, often a more useful measure of risk than volatility, because it describes what a holder actually went through.
The RSI, or relative strength index, compares the size of recent up moves with recent down moves on a scale from 0 to 100. The script splits each day's change into a gain or a loss with clip, smooths both with an exponential average that gives each new day a weight of 1/14, and turns their ratio into the index. That smoothing is Wilder's original method, and it is the one most charting tools use. Readings above 70 are usually called overbought and below 30 oversold, but they describe the past two weeks, not the next two.
Check your indicator
A small mistake in an indicator, such as a simple average where the formula wants a smoothed one, produces numbers that look plausible and are wrong. So compare with an independent calculation. The same API computes indicators itself with TradingView's formulas, and this request returns its 14-day RSI for the last ten days:
https://api.xrpl.to/v1/ohlc/84e5efeb89c4eae8f68188982dc290d8?resolution=D&cb=10&vs_currency=USD&ind=relative-strength-index:14
When this was written, its last five values matched the script's to four decimal places. They agree because a year of history gives the smoothing time to settle; the first two weeks or so of the script's RSI are less reliable, since the exponential average starts from the very first day. If you only need the readings and not the code, an RSI scanner for XRP Ledger tokens shows which tokens are at overbought or oversold levels right now.
Details that trip people up
The last row is today's candle, and it is still forming until the day ends in UTC. Drop it with df.iloc[:-1] if you want completed days only.
Prices are in US dollars because of vs_currency=USD. Change it to XRP to measure a token against XRP instead, which is often more telling for small tokens that mostly trade against it.
Small tokens can be very thinly traded, so a single trade may set a day's close. Look at the volume column before you trust a dramatic return.
Taking it further
From here, pandas does most of the work. Run the script on several tokens and join their returns into one DataFrame to see how they move together with corr(). Resample the daily data to weekly closes with resample("W").last(). Or plot close, ma20 and rsi14 with matplotlib to see the numbers as a chart.
A few rules worth knowing
Anonymous access works but is rate-limited; if you receive a 429 response, wait for the time in its Retry-After header, and get a free key if you need more. Any page that shows the data publicly must credit the source with a visible link, a requirement the API repeats in its own responses. And treat every number here as a description of the past, not a forecast.
XRPL.to is a market-data explorer and trading site for the XRP Ledger with a public API.