
Server rooms have a quiet enemy, and it isn't a rogue script or a misconfigured load balancer. It's the cooling system. When an evaporator coil starts to leak refrigerant or a fan motor begins to drift out of spec, temperatures creep up slowly enough that dashboards barely flinch. Until suddenly, a rack throttles and a service degrades.
For developers and DevOps engineers, that means HVAC telemetry deserves a spot next to CPU load and disk I/O. The good news: the same tools you already use for observability, time-series databases, Python pipelines, and anomaly detection can keep cooling hardware honest long before a technician has to climb on the roof.
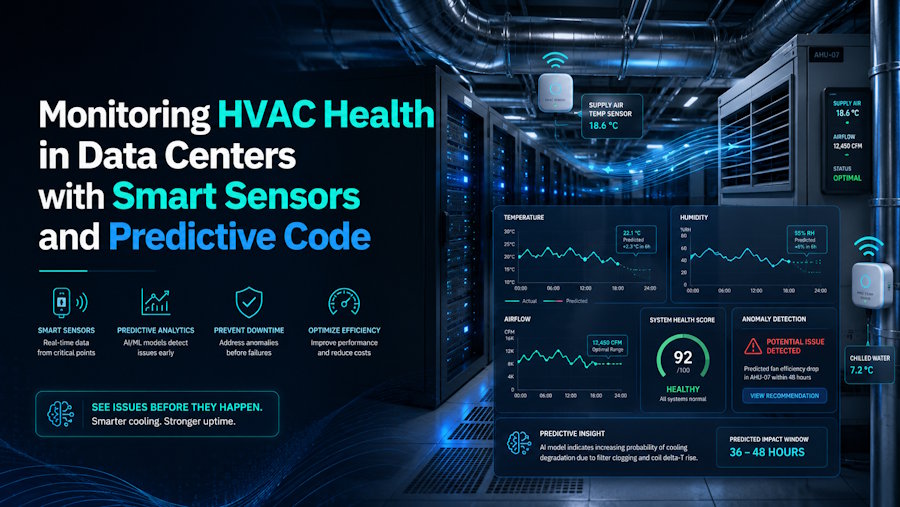
Why cooling telemetry belongs in your observability stack
Most outages in dense compute environments don't begin with a CPU fire. They begin with a slow thermal drift that the facilities team and the platform team each assume the other is watching. Treating HVAC sensors as first-class citizens in your metrics pipeline closes that gap.
The U.S. Department of Energy has long flagged cooling as one of the largest energy loads in a data center, which means a small efficiency loss compounds fast in both power bills and equipment wear. Catching that drift early is a software problem as much as a mechanical one.
If you already ship CPU and memory metrics into Prometheus, InfluxDB, or a cloud-native equivalent, the lift to add temperature, pressure, humidity, and refrigerant indicators is small. The payoff is a single pane of glass where infrastructure and facilities speak the same language.
What to instrument on the cooling side
Before you write a line of code, decide what signals matter. Cooling failures rarely announce themselves with a single metric, so you want overlapping sources that let an anomaly detector triangulate.
- Supply and return air temperature. Track both at the rack level. A widening delta or a steady upward trend at the return is one of the earliest signals that cooling capacity is slipping.
- Differential pressure. Under-floor or containment pressure drifts give you a read on airflow before temperatures react.
- Coil and refrigerant data. Suction pressure, superheat, and subcooling values from the CRAC or CRAH unit are where leaks and fouling show up first. Many modern units expose these over BACnet or Modbus.
- Condensate and humidity. An unexpected drop in condensate flow can hint at reduced load on the coil, which sometimes means refrigerant is escaping.
- Power draw per unit. Compressors that work harder for the same cooling output are telling you something is wrong upstream.
Coil-side issues, in particular, are worth understanding at a mechanical level so your alerts make sense. CS Coil's guide to evaporator coil leaks is a useful primer for engineers building thresholds, because it maps physical failure modes (formicary corrosion, vibration fatigue, acidic condensate) to the symptoms your sensors will actually see.
A simple Python pipeline for anomaly detection
You don't need a deep-learning rig to spot most cooling anomalies. A rolling baseline plus a few statistical guards catches the majority of drift problems with minimal false positives.
- Ingest. Poll BACnet or Modbus endpoints (libraries like BAC0 and pymodbus handle this cleanly) and publish to your time-series database on a 10 to 30 second interval.
- Baseline. For each sensor, compute a rolling median and median absolute deviation over a window that matches the workload cycle, often 24 hours for steady-state racks.
- Score. Flag points that sit outside a tunable number of MADs from the median, and require N consecutive flagged samples before alerting. This filters sensor noise.
- Correlate. Combine signals. A rising return temperature alone is noise. A rising return temperature plus rising compressor amps plus falling superheat is a story.
- Route. Push correlated alerts into the same Slack, PagerDuty, or Opsgenie channels your SREs already watch, with a clear runbook link.
For teams that want a more adaptive approach, libraries like scikit-learn's IsolationForest or Facebook's Prophet can model seasonality, useful when your cooling load tracks business hours or batch jobs. Start simple, though. A median-and-MAD detector you understand beats a neural network you don't.
Closing the loop with facilities
Code can detect a leak forming. It can't braze a copper joint. The most effective setups treat the software layer as a paging system that hands off cleanly to whoever maintains the mechanical equipment.
A few practices keep that handoff from becoming a finger-pointing exercise:
- Shared dashboards. Give facilities read access to Grafana or whatever you use. Engineers and technicians looking at the same chart resolve issues faster.
- Versioned thresholds. Store alert thresholds in Git alongside your infrastructure code. When a setpoint changes, there's a paper trail.
- Post-incident reviews that include HVAC. If a thermal event caused an outage, the postmortem should cover both the mechanical fix and the detection gap.
Industry thermal guidelines, summarized in resources like the data center overview on Wikipedia, give a reasonable starting point for what "normal" looks like, but every room has its own personality. Let your baselines learn the room rather than hard-coding industry numbers.
Where this is heading
Smart sensors are getting cheaper and the protocols are getting friendlier. Wireless refrigerant pressure sensors, edge gateways that speak both MQTT and BACnet, and open-source connectors are all reducing the friction that used to keep HVAC data locked inside a building management system.
For software teams, that opens a small but meaningful expansion of scope. The same instincts that make you good at catching a memory leak, baselines, correlation, and alert hygiene transfer almost directly to catching a refrigerant one. The earlier you see it, the cheaper it is to fix, and the less likely your users ever notice.

