

Containers stopped being a side project years ago. Kubernetes now runs in production for 82% of container users, up from 66% in 2023, according to the CNCF 2025 Annual Cloud Native Survey. That’s a fast climb, and it means most engineering teams are managing fleets of containers that spin up, scale, and disappear within minutes. Watching that kind of environment with a dashboard built for static servers just doesn’t work anymore.
The stakes are real money, too. Komodor’s 2025 Enterprise Kubernetes Report found that 62% of companies estimate major downtime costs at $1 million per hour, and teams lose roughly 64 workdays a year just tracking down and fixing issues. Pick the wrong monitoring tool, and you’re not just missing alerts; you’re burning weeks of engineering time that could go toward shipping features. Below are eight tools worth evaluating in 2026, starting with the one built specifically for the real-time, low-overhead visibility that ephemeral containers demand.
What to look for in a container monitoring tool
Not every monitoring platform handles containers the same way, and the gaps show up fast once you’re running dozens or hundreds of short-lived pods. A few criteria matter more than the rest.
Real-time, per-second granularity beats minute-by-minute polling. A container that spikes CPU and crashes in 20 seconds won’t show up in a dashboard that only samples every 60 seconds. Agent overhead matters too; heavy agents that eat into the resources of the very containers they’re watching defeat the purpose. Kubernetes-native support is close to non-negotiable now, given how dominant the platform has become. Security and compliance coverage also deserve attention. NIST’s Application Container Security Guide (SP 800-190) lays out the risks specific to containerized workloads, from image vulnerabilities to runtime threats, and any serious monitoring tool should help you catch those issues before they become incidents. Pricing model and ease of setup round out the list. Some tools charge per host, others per container, and the difference adds up fast at scale.
With those criteria in mind, here’s how the major players stack up.
1. Netdata
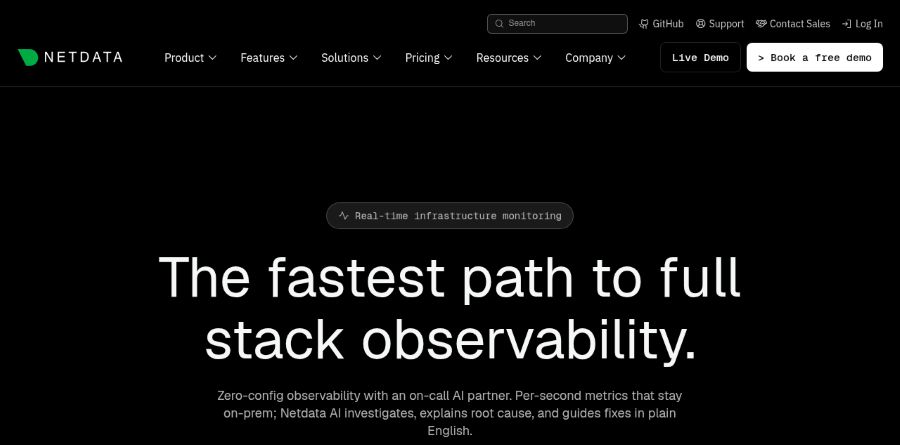
Netdata tops this list because it solves the granularity problem better than almost anything else on the market. It auto-discovers containers the moment they start, collects metrics every single second, and shows you what’s happening right now instead of a smoothed-over average from five minutes ago. That’s one of the best container monitoring tools available for teams who need to catch a memory leak or a crash loop before it takes down a service, not after.
The setup is genuinely light. Point it at your Kubernetes cluster or Docker hosts and it starts mapping containers, pods, and nodes without hours of configuration. Its open-source core includes a free tier, which matters for teams that don’t want to commit budget before proving value. Netdata also ships built-in machine learning anomaly detection, so it flags unusual behavior automatically rather than waiting for someone to notice a threshold breach. Given that Komodor’s data pegs the average team at 64 workdays a year chasing down issues, shaving hours off detection time on every incident adds up fast. The tradeoff is that Netdata leans more toward infrastructure and container metrics than full application tracing, so teams needing deep distributed tracing may still want a companion tool.
2. Datadog
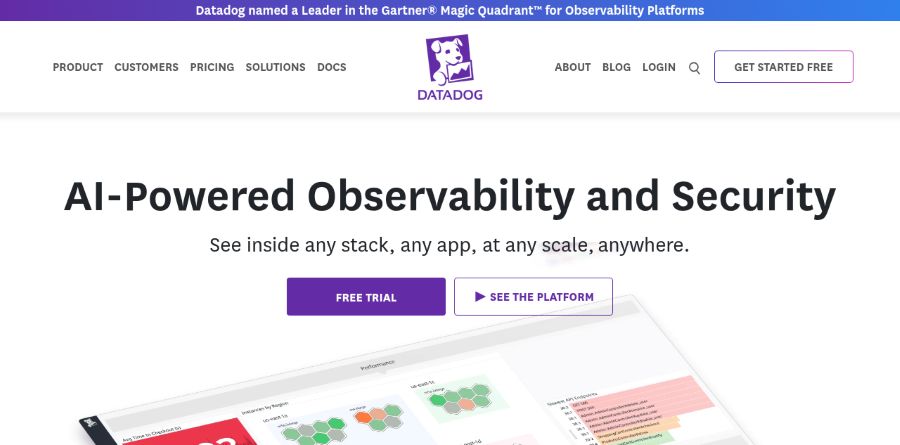
Datadog built its container story around eBPF, which lets it inspect every syscall without inserting heavy instrumentation into your application code. That gives it deep visibility into network calls, security events, and performance bottlenecks across Kubernetes clusters. It also folds container monitoring into a much broader platform: APM, log management, and infrastructure monitoring all live under one roof. The catch is cost. Industry pricing estimates put Datadog around $23 per host per month for infrastructure monitoring alone, and that climbs quickly once you add APM and log ingestion for a fleet of any real size.
3. Prometheus + Grafana

Prometheus and Grafana remain the open-source standard that most Kubernetes-native tooling gets measured against. Prometheus collects and stores metrics through a pull-based model, while Grafana turns that data into dashboards teams can customize down to the pixel. The combination is extensible enough to monitor almost anything you can instrument, and it costs nothing in licensing fees. The real cost shows up in maintenance. Someone on your team needs to manage storage retention, write and tune alerting rules, and keep the whole stack patched, which is a steeper curve than a managed SaaS product. For teams that already track application performance closely, pairing this stack with a broader read on application performance monitoring practices helps decide where Prometheus fits versus a hosted alternative.
4. Dynatrace
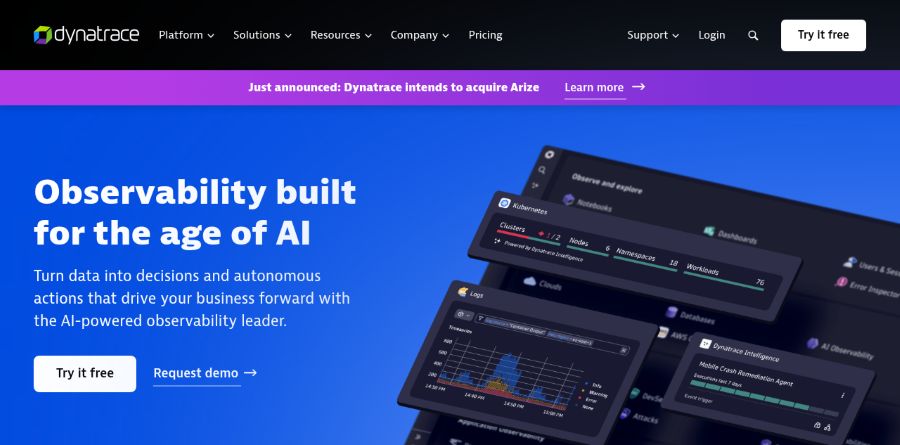
Dynatrace leans hard into AI-driven root-cause analysis, tracing an incident back through dependencies automatically instead of leaving engineers to piece together the chain themselves. That makes it a strong fit for large, regulated enterprises that need HIPAA, SOC 2, or GDPR-aligned monitoring baked into the platform. The flip side is complexity and cost. Dynatrace’s feature depth comes with a steeper learning curve and pricing that tends to favor larger organizations over smaller teams still figuring out their container strategy.
5. Sysdig
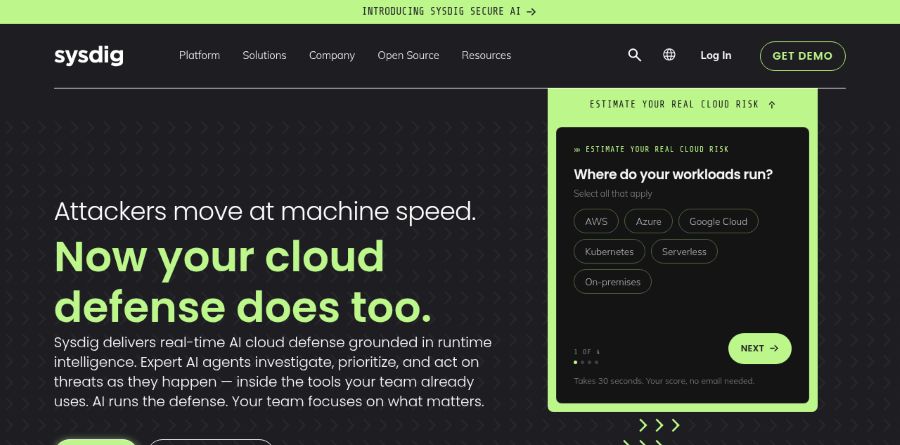
Sysdig takes a security-first approach to container and Kubernetes runtime monitoring. It combines vulnerability scanning with performance metrics in a single platform, which appeals to organizations in finance, healthcare, or government work where compliance audits are routine rather than occasional. Teams that treat security scanning as a checkbox exercise elsewhere often find Sysdig’s runtime threat detection catches issues that static scans miss. It’s a narrower tool than some others on this list, built more for security and compliance teams than for general-purpose observability.
6. New Relic
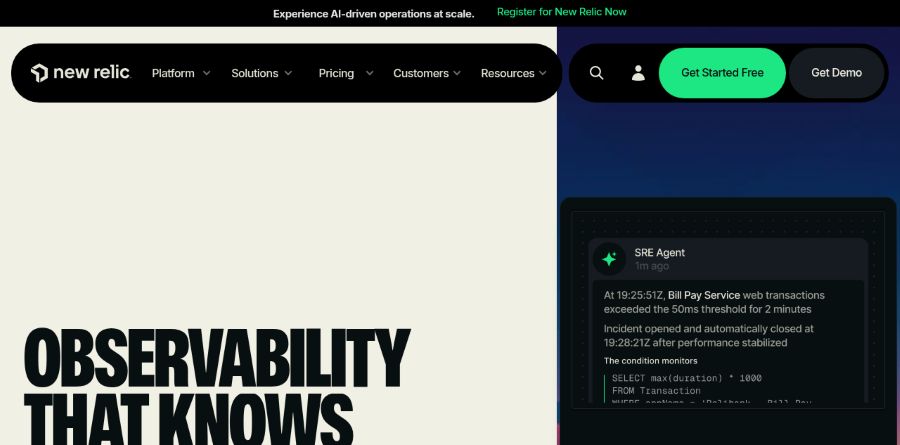
New Relic positions itself as an all-in-one observability platform covering infrastructure, APM, logs, and browser monitoring from one interface. Its AI-powered anomaly detection flags unusual patterns across that combined dataset, and its integration ecosystem covers most of the tools a modern engineering team already uses. For organizations that want a single vendor handling everything from container metrics to front-end performance, New Relic reduces the number of dashboards teams have to check.
7. Middleware
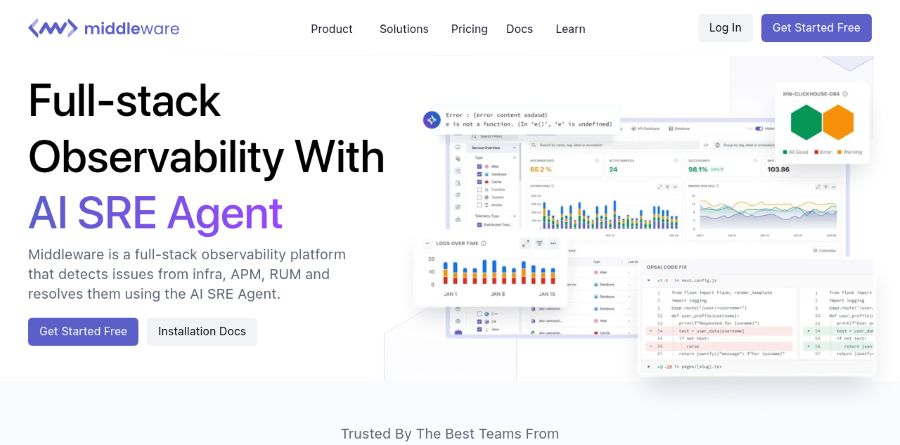
Middleware markets itself around Kubernetes-native orchestration support, unifying metrics, logs, and traces in one place with pricing aimed at mid-size teams rather than enterprise budgets. It covers compliance needs reasonably well and has picked up traction among teams that outgrew a purely open-source stack but aren’t ready for enterprise-tier pricing. It’s a younger platform than most others here, so its feature set is still catching up to the more established players.
8. Portainer
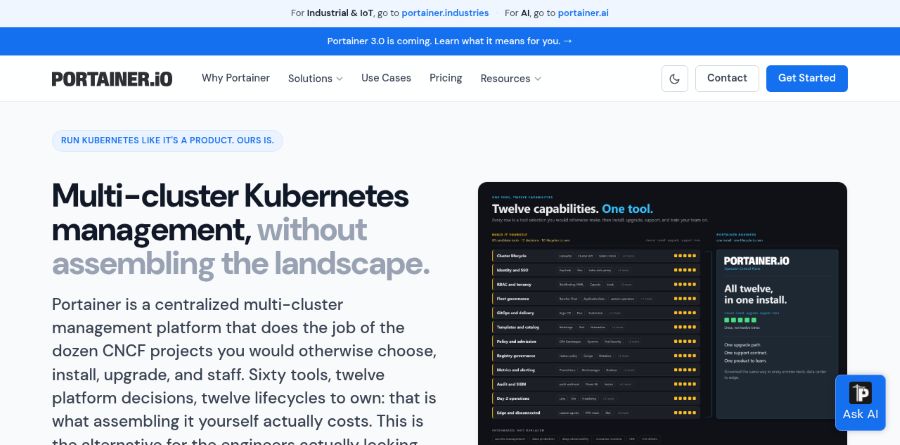
Portainer is worth including for a different reason: it’s not really a deep observability suite. It’s a lightweight management UI for Docker and Kubernetes that gives smaller teams a visual way to manage containers across on-prem, cloud, and edge environments without living in the command line. Teams running a smaller footprint often pair Portainer’s management interface with a dedicated monitoring tool from earlier in this list, since Portainer alone won’t give you the per-second metrics or anomaly detection that a real monitoring platform provides. If your team is also building out broader automation around deployment, our piece on DevOps infrastructure automation covers where that fits alongside container management tools like this one.
Choosing the right fit
The container monitoring market is projected to grow from roughly $1.3 to $1.5 billion in 2025-2026 to somewhere between $6 and $8.5 billion by the early 2030s, according to GII Research’s container monitoring market reports. That kind of growth isn’t surprising once you consider that 56% of organizations now run most or all of their production applications in containers, up from 41% in 2023, per Forbes’ analysis of the CNCF 2025 survey. Container fleets aren’t shrinking, and neither is the visibility gap for teams still using tools built for a slower, more static infrastructure era.
There’s no single right answer here. Teams that need immediate, granular visibility without a heavy setup process tend to gravitate toward real-time, low-overhead options. Security-heavy industries lean toward runtime scanning built for compliance audits. Large enterprises with regulatory obligations often need the AI-driven root-cause tracing that comes with a bigger platform and a bigger price tag. Smaller teams managing containers across a handful of environments sometimes just need a clean management interface paired with something else doing the actual metrics work. Match the tool to how your containers actually behave in production, not to whichever vendor has the loudest marketing, and the rest of the decision gets a lot easier. For teams still mapping out how containerized workloads move from build to production, our overview of containerized application deployment is a useful next read.